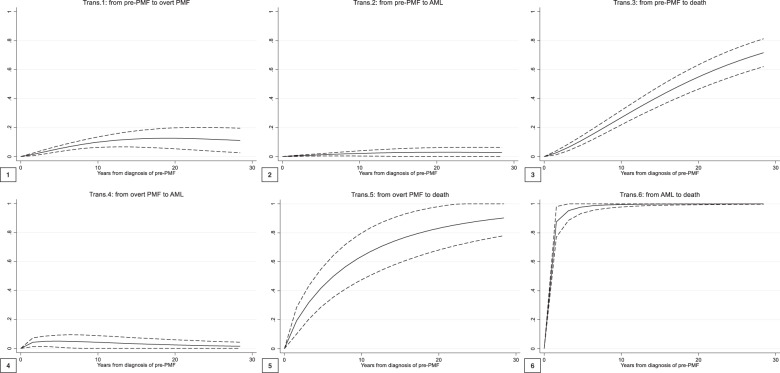
Fig. 2. Transition probabilities over time from pre- to overt PMF, AML, and death (1, 2, and 3), from overt PMF to AML and death (4 and 5), and from AML to death (6).
Trans transition, AML acute myeloid leukemia, PMF primary myelofibrosis. This figure shows the six transition probabilities of the multistate model for the clinical course of pre-PMF. Transition probabilities are defined as the probability of going from a given state to the next state in a Markov process. Direct transitions (panels 1–3) refer to all the 382 patients initially at risk (the pre-PMF state); thus, they represent the probability that a patient with a pre-PMF can directly evolve into overt PMF or AML or die. Panels 4–6 show the probabilities of indirect transitions, calculated starting from the corresponding previous intermediate state.

