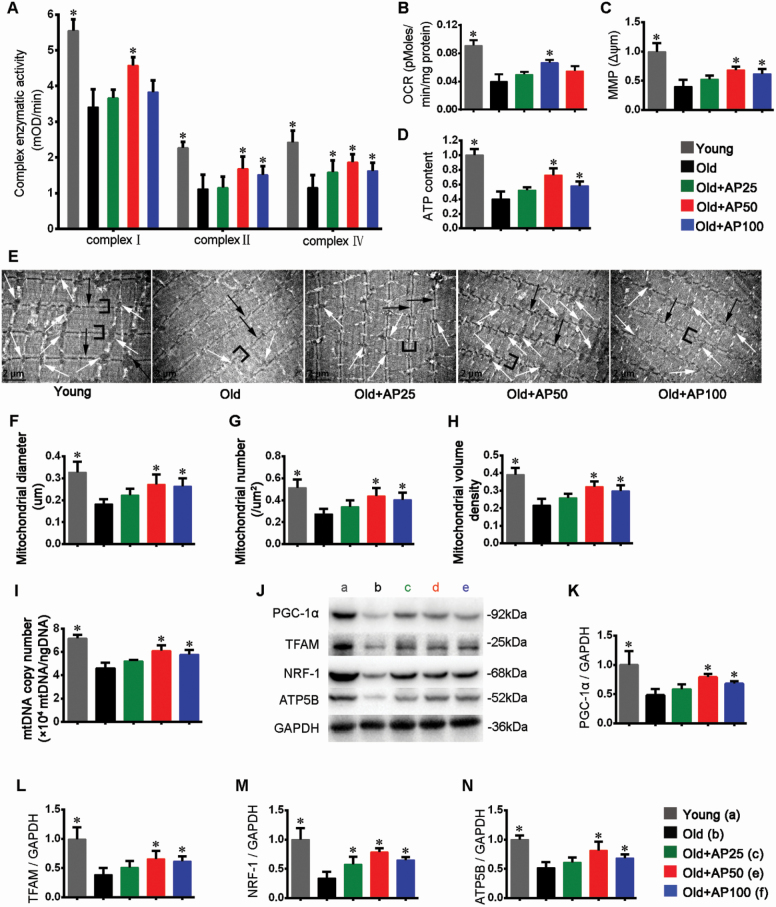
Figure 3.
Apigenin improved mitochondrial function and promoted mitochondrial biogenesis in skeletal muscle of aged mice. (A) Activities of mitochondrial complexes I, II, and IV. (B) Oxygen consumption rate (OCR). (C) Mitochondrial membrane potential (MMP) Δψm. (D) ATP content. (E) Transmission electron microscopy micrographs (magnification: 12 000) of tibialis anterior (TA) muscles. White arrows indicate mitochondria, black arrows the Z-line, and brackets the I-bands. Scale bar: 2 μm. Quantitative analysis of mitochondrial (F) size, (G) number, and (H) volume density. (I) The relative mitochondrial DNA (mtDNA) copy number. (J) Representative images and quantification (fold change from Young) of (K) PGC-1α, (L) TFAM, (M) NRF-1, and (N) ATP5B were shown. Data are presented as the mean ± SD (n = 8–10). *p < .05, versus the Old group (25 months).

