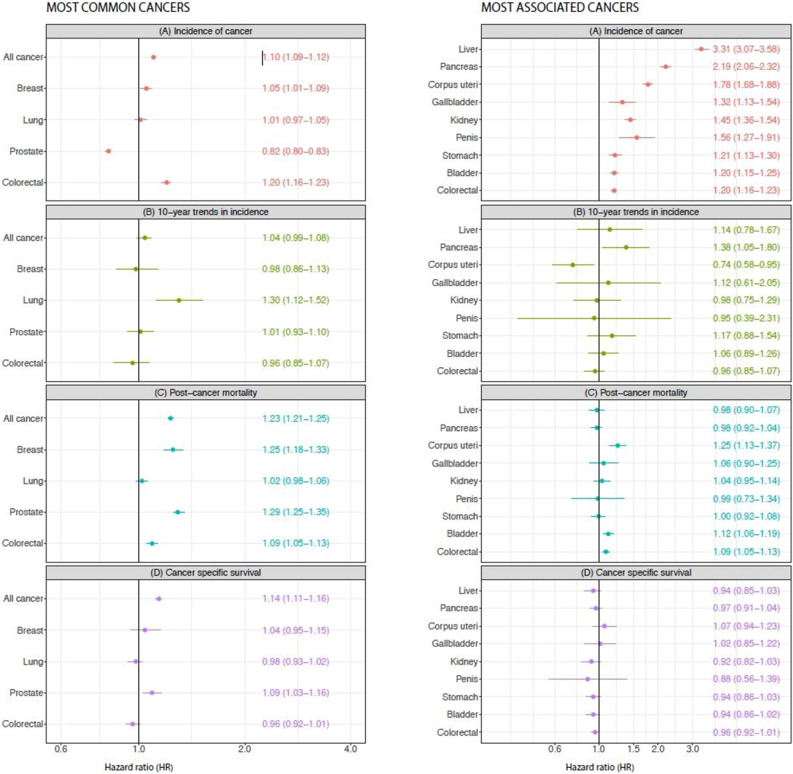
Figure 2.
Hazard ratios for cancer incidence, 10-year trends, post-cancer mortality, and cancer specific survival in Type 2 diabetes patients versus matched controls. (Red) Hazard ratios of incidence; (Green) hazard ratios for 10-year trends in incidence; (Blue) hazard ratios for post-cancer mortality for the most common (a) and most associated (b) cancer sites. Incidence model adjusted for sex, education, income, marital status and geographical region of birth. Time trends in incidence were adjusted for age and gender. Post-cancer mortality model adjusted for sex, age, education, marital status and income.

