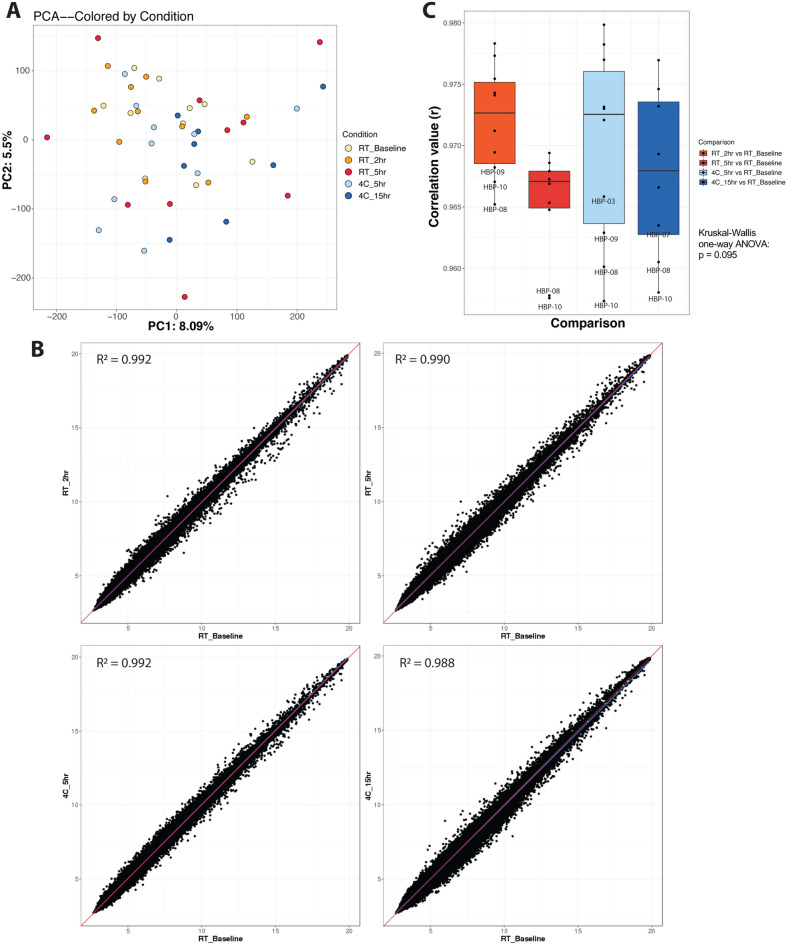
Figure 3.
Whole blood transcriptomes are largely stable over time. (A) PC analysis of samples containing all conditions tested. Axis percentages indicate variance contribution. (B) Correlation scatterplots between baseline and each condition tested. Values were averaged for each probe for a particular condition. (C) Paired correlation analysis between each condition compared to baseline for all individual subjects (p = 0.095; Kruskal–Wallis One-Way ANOVA). (n = 10 per condition, except n = 8 for the 15 h time point as two samples, HBP-04 and 09, did not meet ThermoFisher microarray QC metrics).

