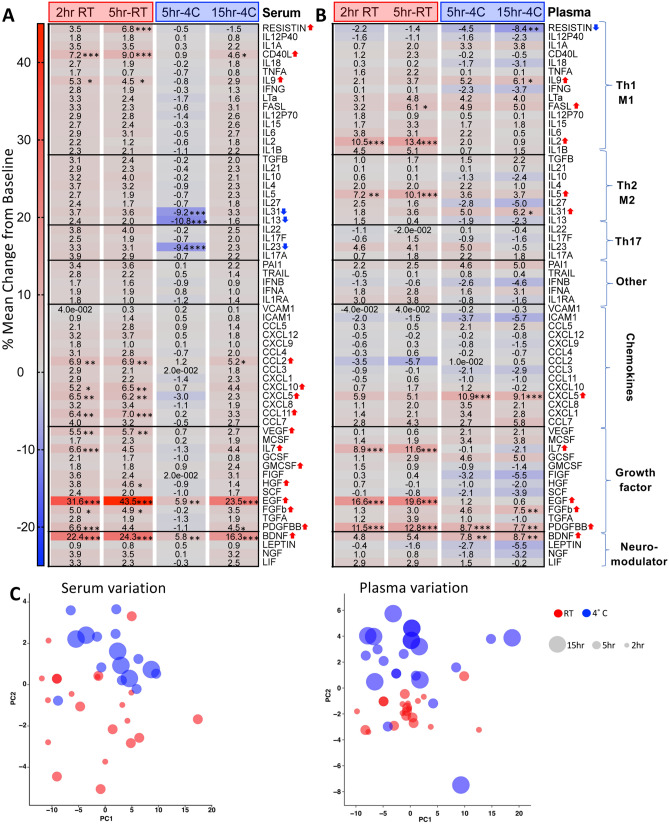
Figure 6.
Serum and plasma cytokines are differentially impacted by temperature and processing delays. Heatmaps showing % change in 62 cytokines as a function of each individual’s baseline in serum (A) and plasma (B). Mean % change was calculated by dividing each time point by the baseline time point for each respective individual and cytokine, multiplying by 100, subtracting 100 to get the % change, and then computing the mean of the cohort’s % change. Cytokines grouped by putative functional groups and ranked by abundance in blood for each subgroup. (C) PCA plots showing effect of temperature (color code) and time (circle size) for each individual on aggregate cytokine variation in serum and plasma. (n = 10 per condition; *p < 0.05, **p < 0.01, ***p < 0.001; repeated-measures Two-Way ANOVA Bonferroni posthoc test for multiple comparisons).

