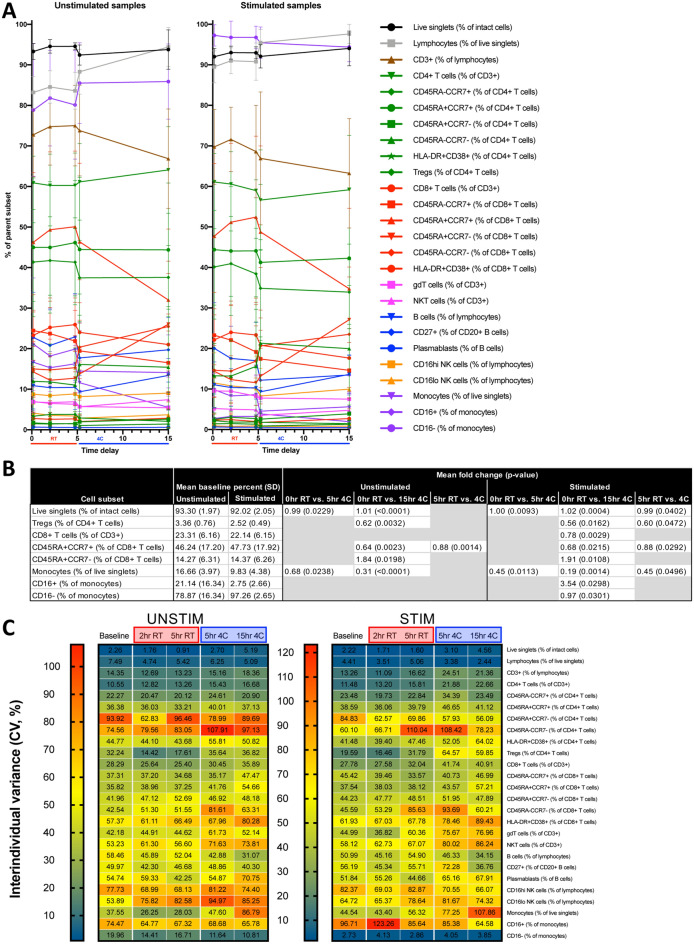
Figure 7.
Select cellular features are impacted by processing delay and refrigeration. (A) 26 canonical cell populations were gated and traced between five conditions for unstimulated (left) and stimulated (right) samples. Each condition was compared to baseline for unstimulated or stimulated samples, and (B) significant differences were identified. RT was also compared to 4C for the 5 h conditions. (C) Interindividual variance (CV) for 26 canonical cell populations was calculated for each five conditions for unstimulated (left) and stimulated (right) samples. Statistics: paired two-tailed Student’s T-test with BH method correction for multiple comparisons. Mean fold change was calculated by taking the average of the fold change for each individual. (n = 10 per condition).

