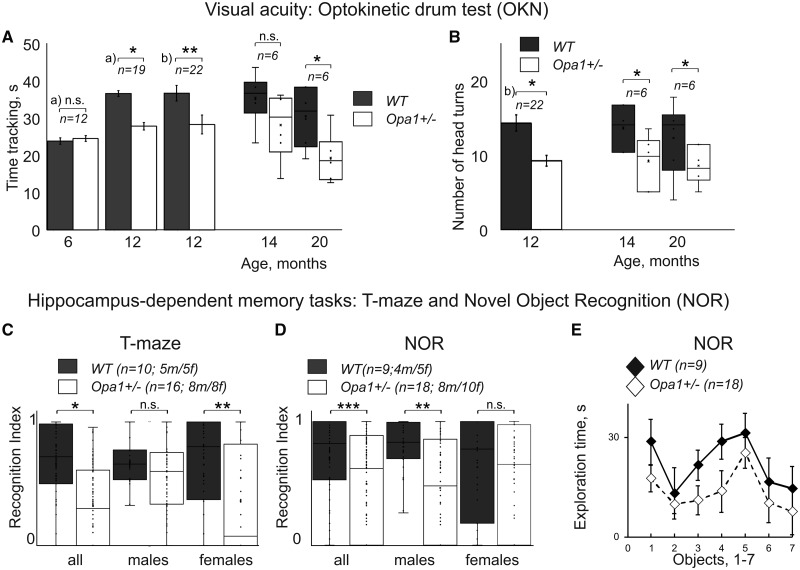
Figure 1.
Summary of mice behavioural data. (A, B) Two measures of mice visual acuity using reflex responses in optokinetic drum (OKN) at different ages. The n represents the minimum number of animals per group for a given experiment. (A) Total time tracking drum rotation as a function of genotype and animal age. Data obtained in this study are depicted as whisker plots and previously published data for younger age (a) and Davies et al., 2007; b) Smith et al., 2016) are shown as bar plots. (C, D) Recognition index in hippocampus-dependent learning and memory tasks at 15 months of age. (C) T-maze. (D, E) Novel object recognition (NOR) task. Data are shown for two genotypes for all animals and separately for males and females. The n represents the number of animals per group for a given experiment; the male/female ratio was 50/50, the exact numbers are specified for each experiment. (E) Difference in exploration time between seven different objects used in NOR task (averaged for all animals). All data are presented as mean and SE, significance levels marked with *, **, *** for P-values 0.05, 0.01 and 0.001 accordingly. T-test was used to compare groups for OKN time tracking, and TB, TN and TF values in T-maze and NOR; Mann–Whitney U-test was used to compare values that were not normally distributed (number of head turns in OKN task, RI in T-maze and NOR). Meta-analyses of visual acuity data is shown in Supplementary Fig.1. Additional data for the learning and memory tests are shown in Supplementary Fig. 2.

