Figure 3.
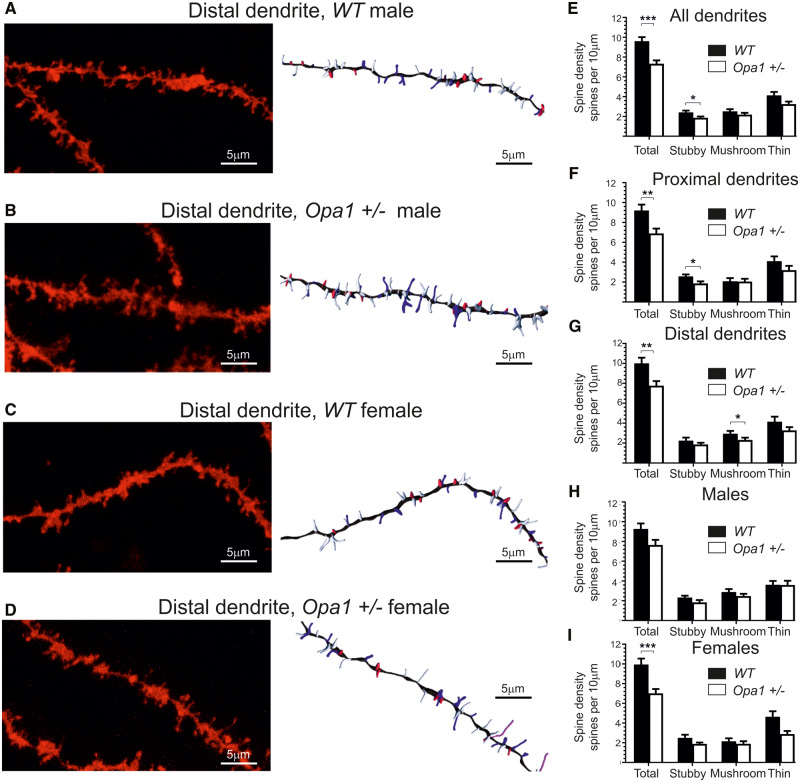
DiOlistic cell labelling, spine analysis. (A–D) CA1 pyramidal cells apical dendrites imaged with confocal microscope ×40. The right panels represent the same dendrite with spines automatically detected and classified (Imaris). (A) A CA1 neuron in WT male. (B) A CA1 neuron in WT female. (C) A CA1 neuron in Opa1+/− male. (D) A CA1 neuron in Opa1+/− female. (E) Average spine density for all spines. (F,G) Location differences in spine morphology between distal and proximal regions (F Distal, G Proximal). (H,I) Gender differences in spine morphology for all dendrites (H-males, I-females). The images (one dendritic segment per labelled neuron) were obtained from a total of 36 different neurons for each genotype (18 dendritic segments corresponded to proximal with the other 18 corresponding to distal, when separated into males and females the total number of dendritic segments analysed totalled 18 for each group). All data are presented as mean and SE. Statistical analysis was performed by non-parametric Kruskal–Willis test; P-values *<0.05, **<0.01, ***<0.001.

