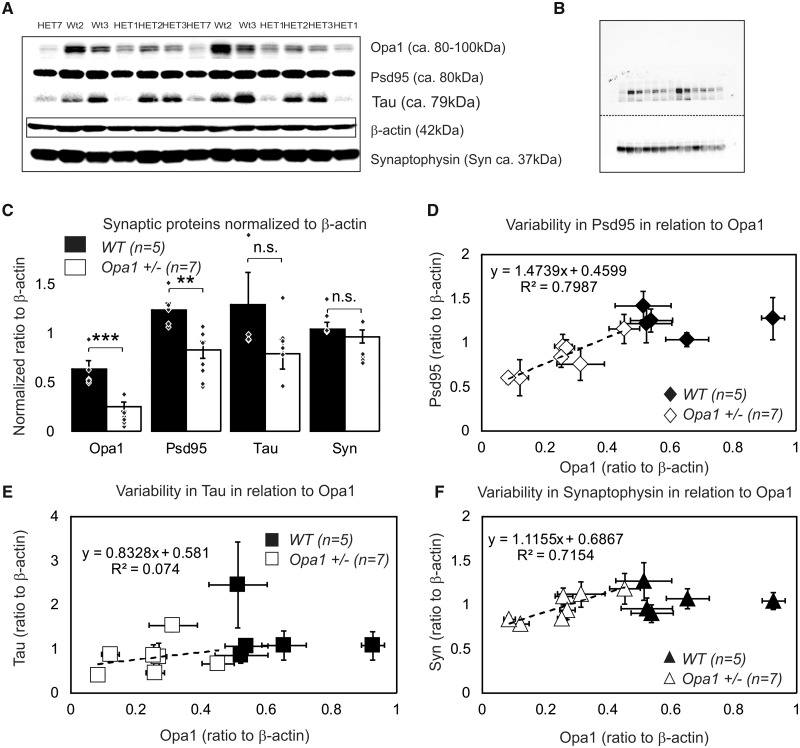
Figure 5.
Protein quantity assessment by western blot in 16 months old mice. (A) An example of optimized western blot bands for gel (1 out of 6) containing 13 samples. The results shown in the panels A were obtained from 6 animals [2 WT and 4 Opa1 (+/−)] and tested in triplicate. The experiment was repeated two more times (three biological samples per group) with smaller subset of proteins. All data were pooled together for B. Original (non-optimized) western blot membrane for gel 1 showing separately high molecular weight bands [OPA1 (top double band), PSD95, and Tau protein bands appearing simultaneously in close proximity] and low molecular weights bands (synaptophysin and β-actin). Row data are presented in Supplementary Fig. 5. (C) Average amount of proteins (normalized to β-actin; the n indicates number of independent biological samples). An average value for each independent biological sample is represented by individual point. All data are presented as mean and SE. P-values *<0.05, **<0.01, ***<0.01. (D–F) Variability in the level of relative expression of synaptic proteins in relation to levels of OPA1 protein in the sample. (D) PSD95. (E) Tau. (F) Synaptophysin. Data are represented as mean and SE of multiple repeats within the single biological sample.

