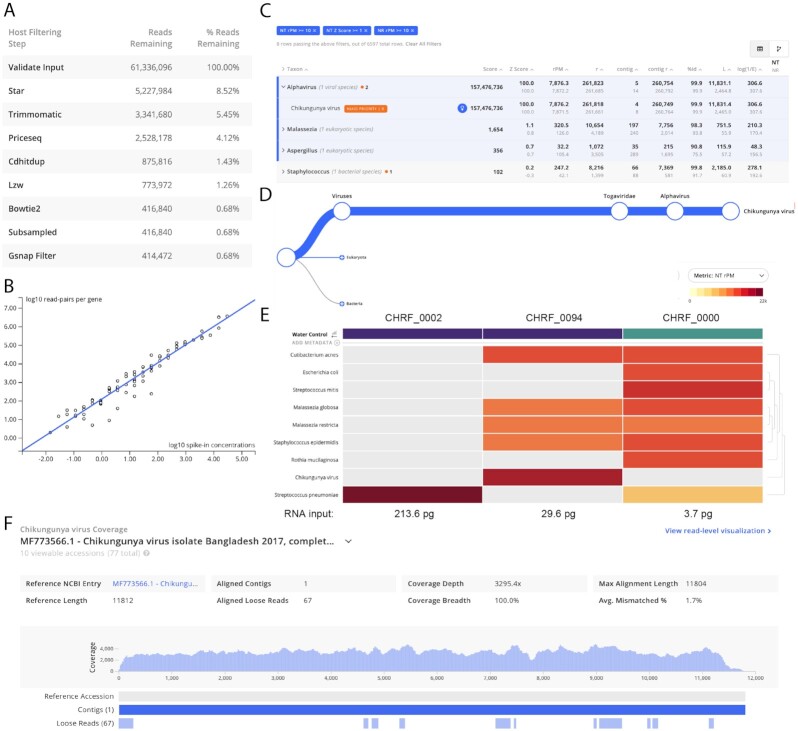
Figure 2:
The IDseq web application provides multiple easy-to-use visualizations to help the user assess the quality and content of their sample. Screenshots taken from the IDseq Portal correspond to the re-analysis of samples from a study of etiologies of pediatric meningitis originally published by Saha et al. [1] (see section Application I). CHRF_0002 and CHRF_0094 are CSF samples from pediatric patients with meningitis due to Streptococcus pneumonia and chikungunya virus, respectively. CHRF_0000 is a water control. (A) Table of reads remaining during each step of the host filtration step (for CHRF_0094)—interpretation of the relative loss at each step in can provide insight into the quality of the library preparation and sequencing run. (B) Automatic quantification of ERCC counts from sample CHRF_0094; ERCC quantification enables back-calculation of input RNA concentration. (C) The results for a single sample (CHRF_0094) are presented as a table, with key metrics for interpreting taxon alignment quality. (D) The tree view indicates the relative abundance of sequences and their taxonomic relationship within a particular sample; shown is the relative abundance of chikungunya virus reads in CHRF_0094. (E) The results from multiple samples can be compared using the IDseq heat map view, with associated metadata (purple = CSF, blue = water control). The interactive heat map visualization can be viewed at [42]. The heat map is especially powerful when analyzing trends across a larger number of samples. (F) Coverage of chikungunya virus in CHRF_0094; the coverage visualization enables rapid interrogation of genome coverage.

