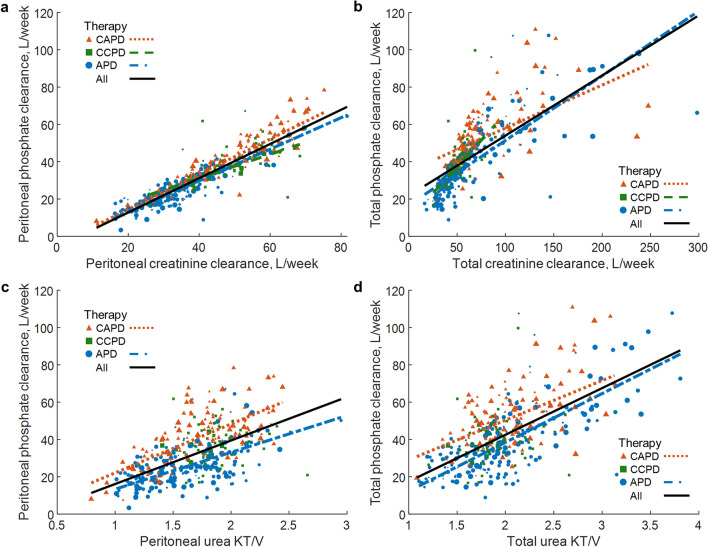
Figure 1.
Phosphate clearance versus creatinine clearance and urea KT/V. Peritoneal (a) and total (b) phosphate clearances versus peritoneal and total creatinine clearances, respectively, as well as peritoneal (c) and total (d) phosphate clearances versus peritoneal and total urea KT/V, respectively, for continuous ambulatory (CAPD), continuous cyclic (CCPD), automated peritoneal dialysis (APD) and jointly for all therapies. Shown are only regression lines at p value < 0.05 (compare Table 3 and Supplementary Table S1). Equations of regression lines for (a) CAPD: y = 0.94x − 4.38, CCPD: y = 0.64x + 5.78, APD: y = 0.85x − 4.04, All: y = 0.92x − 5.57; (b) CAPD: y = 0.23x + 34.90, CCPD: y = 0.57x + 8.84, APD: y = 0.35x + 16.69, All: y = 0.32x + 21.77; (c) CAPD: y = 26.19x − 4.07, APD: y = 19.75x − 6.38, All: y = 23.33x − 7.19 and (d) CAPD: y = 21.26x + 7.80, APD: y = 26.16x − 13.87, All: y = 25.03x − 7.54. Size of points reflects the measurement´s weight.

