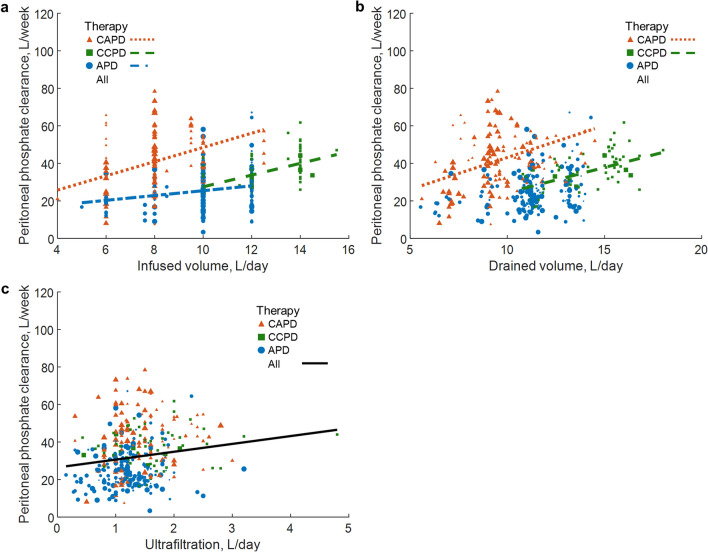
Figure 3.
Peritoneal phosphate clearance versus volumes of infusion, drainage and ultrafiltration. Peritoneal phosphate clearance versus infused volume (a), drained volume (b) and ultrafiltration (c), for continuous ambulatory (CAPD), continuous cyclic (CCPD), automated peritoneal dialysis (APD) and jointly for all therapies. Shown are only regression lines at p value < 0.05 (compare Table 3). Equations of regression lines for (a) CAPD: y = 3.79x + 10.63, CCPD: y = 3.12x − 3.70, APD: y = 1.29x + 12.59; (b) CAPD: y = 3.41x + 9.04, CCPD: y = 2.68x − 2.33 and (c) All: y = 4.18x + 26.47. Size of points reflects the measurements´ weight.

