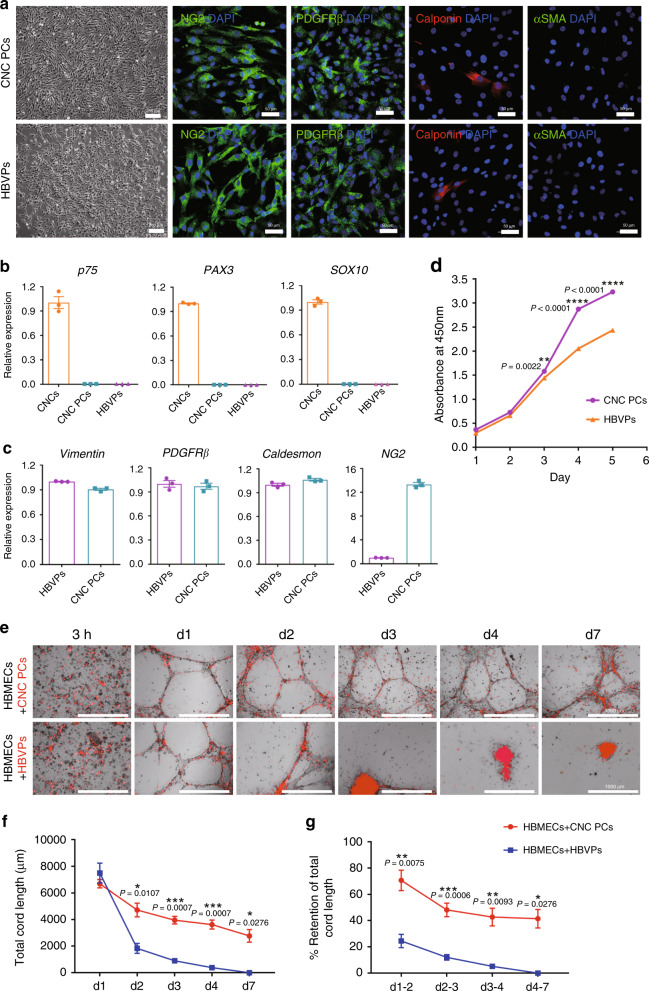
Fig. 3. Characterization and cord formation potential of hPSC-CNC PCs.
a The cell morphology and expression of pericyte markers (Calponin, αSMA, NG2, and PDGFRβ) of hPSC-CNC PCs and HBVPs were revealed by phase-contrast microscopy and immunostaining, respectively. Scale bar: 250 μm (phase-contrast image) and 50 μm (immunostaining image). b qPCR assay for the expression of CNC-specific genes (p75, SOX10, PAX3) in hPSC-CNC PCs and HBVPs. c qPCR assay for the expression of pericyte markers (Vimentin, NG2, Caldesmon, and PDGFRβ) in hPSC-CNC PCs and HBVPs. d The proliferation activity of hPSC-CNC PCs and HBVPs was assessed by CCK8 assay. e A cord formation assay was used to monitor the vascular stabilization potential of hPSC-CNC PCs and HBVPs. Scale bar: 1000 μm. f Total cord length was measured and compared between the hPSC-CNC PC group and the HBVP group. g The retention of total cord length in the hPSC-CNC PC group and the HBVP group was calculated and compared. Graphs represent the individual data points, the mean ± SEM of three independent experiments. Confocal and cord images are representative of n = 3 biological replicates. P-value (*P < 0.05, **P < 0.01, ***P < 0.001, ****P < 0.0001) was calculated by two-tailed unpaired Student’s t-test. Source data are provided as a Source Data file.

