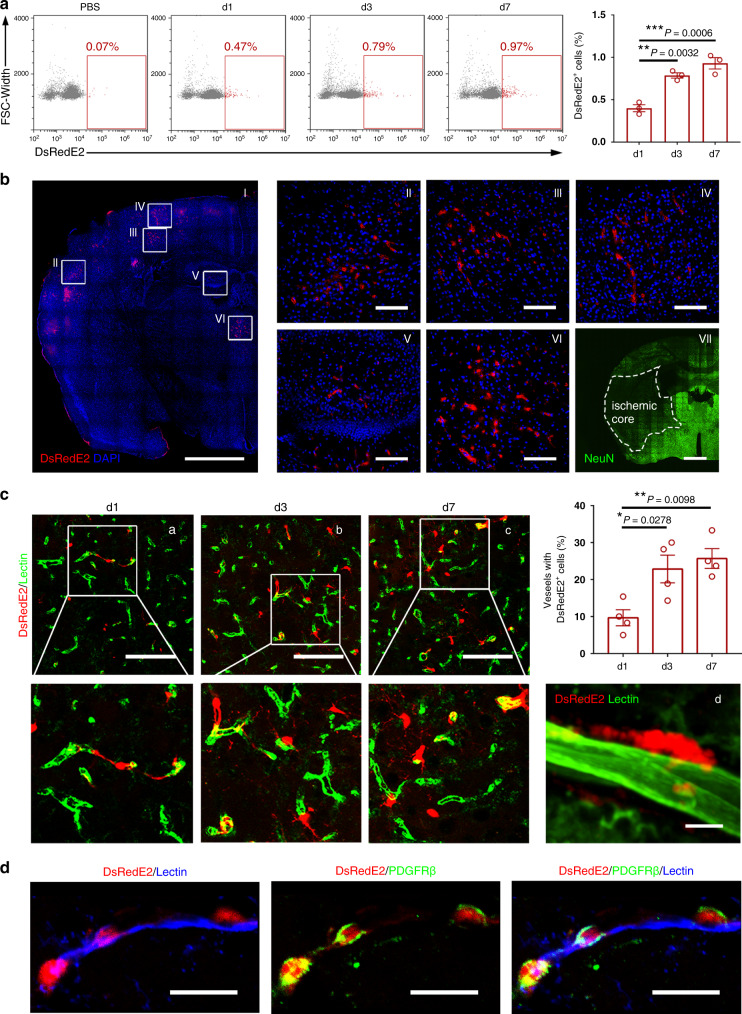
Fig. 9. Temporal and spatial dynamics of infused CNC PC accumulation in tMCAO mice.
a Temporal and quantitative characterization of the infused CNC PCs by whole brain FACS for the PBS-treated control at 1, 3, and 7 days posttransplantation. b Representative images showing that DsRedE2-labeled CNC PCs were mainly distributed in the penumbra area of the ipsilateral hemisphere at 3 days posttransplantation (a–f). Immunostaining of the NeuN+ (green) neurons was applied to identify the area of the ischemic core (g). Scale bar: 100 µm (b–f); 1000 µm (a, g). c Temporal dynamics of DsRedE2+ CNC PC accumulation in the ipsilateral hemisphere. Representative confocal microscopy images showing the DsRedE2+ CNC PCs distributed and extended over the lectin-labeled capillaries. Scale bar: 100 µm (a–c); 10 µm (d). d Transplanted DsRedE2+ CNC PCs maintained the expression of the pericyte-specific marker PDGFRβ (violet). Scale bar: 10 μm. Graphs represent the individual data points, and data are presented as mean ± SEM. Confocal images are representative of n = 4 (b, c, d) biologically independent animals and FACS images are representative of n = 3 (a) biologically independent animals. P-value (*P < 0.05, **P < 0.01, ***P < 0.001, ****P < 0.0001) was calculated by one-way ANOVA with Tukey post hoc test for multiple comparisons (a, c). Source data are provided as a Source Data file.

