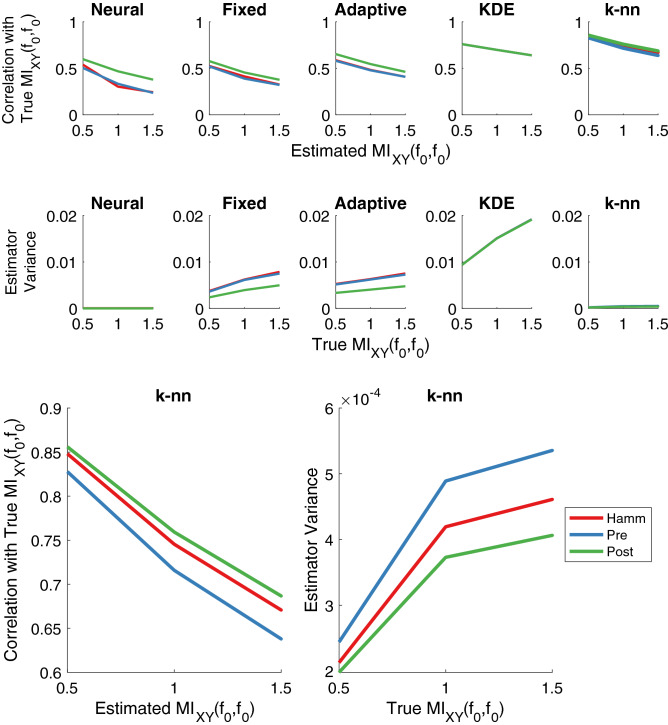
Figure 5.
Top row: performance of MIF estimation approaches measured by the correlation between estimated and true MIF values for frequency (7–9). k-nn with the post multitaper approach performs best (highest correlation). Each point is the correlation between 1e4 MIF estimates (1e3 for KDE and the neural network because of infeasible computation time) using 100 sample paths and a range of true MIF values, the center of which is used as the x value. Ranges spanned around the center. Second row: estimator variance for different true MIF values. Except for the neural network and Kernel Density Estimation (KDE), post has the lowest variance across all approaches which corresponds to it having the highest performance across windowing methods. Pre exhibits slightly lower variance than post for the neural network and KDE displays no differentiation for windowing methods. Sample sizes same as top row. Bottom: enlargement of k-nn correlation and variance plots.

