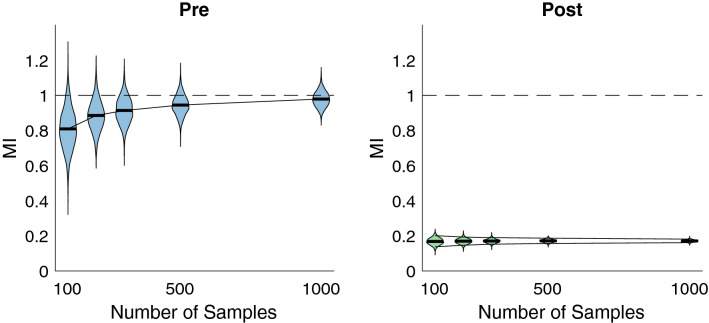
Figure 6.
Analysis of asymptotic properties of pre and post approaches with the k-nn estimator. Left: violin plots42 display the distribution of MIF estimates as a function of sample size in relation to the true MIF value indicated by the dashed line. 1e3 estimates comprise each distribution. The trendline intersects the mean of each distribution in order to indicate decreasing bias with increasing number of samples, while the narrowing of the distributions indicate decreased variance with increased sample size. Right: same analysis performed for the post estimator, which exhibits poor bias but considerably smaller variance than the pre estimator. The decrease of this variance with sample size is highlighted by the two trendlines following the 5th and 95th percentiles of each distribution.

