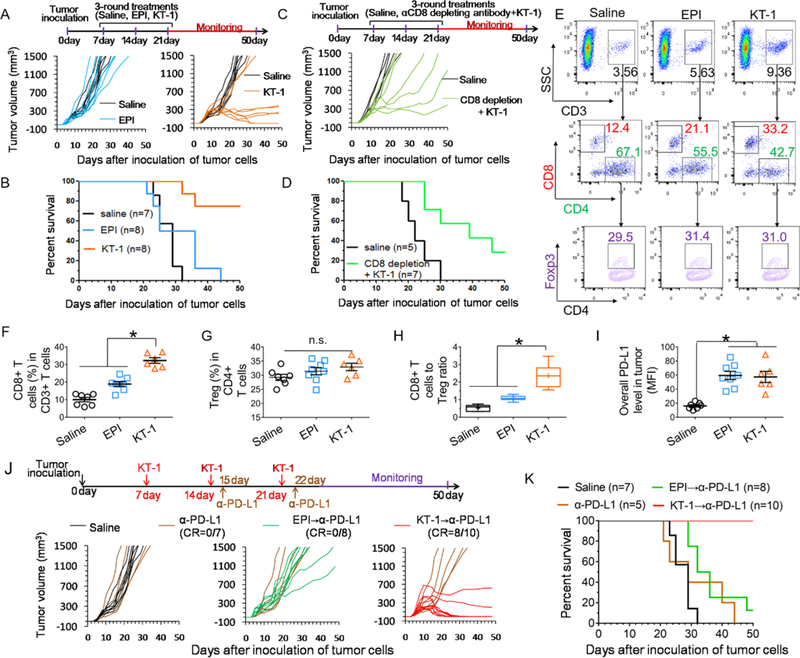
Figure 3. KT-1 improves in vivo outcomes in a CD8+ T cell-dependent manner and leads to adaptive enrichment of tumor PD-L1 expression.
(A) Individual tumor growth curves and (B) animal survival rate over time after treatments with saline, EPI and KT-1. The arrows indicate the treatment regimens. (C) Individual tumor growth curves and (D) animal survival rate over time after co-treatment with CD8-depleting antibodies and KT-1. The arrows indicate the treatment regimens. (E) Flow cytometry scatter plot representation of CD8+ T cells and CD4+Foxp3+ Tregs, and statistics of (F) tumor recruitment of CD8+ T cells, (G) Tregs, (H) CD8+ T cells to Treg ratio, and (I) PD-L1 expressions within tumor cells after chemotherapy with EPI and KT-1 indicated in (A). (J) Individual tumor growth curves and (K) animal survival rate over time after saline, EPI, and KT-1 treatments in combination with α-PD-L1. The arrows indicate the treatment regimens. CR, complete tumor regression. n=5–10, *P< 0.05, n.s., not significant, one-way ANOVA with Tukey’s multiple comparison test, box plots represent whiskers, 5th to 95th percentile.

