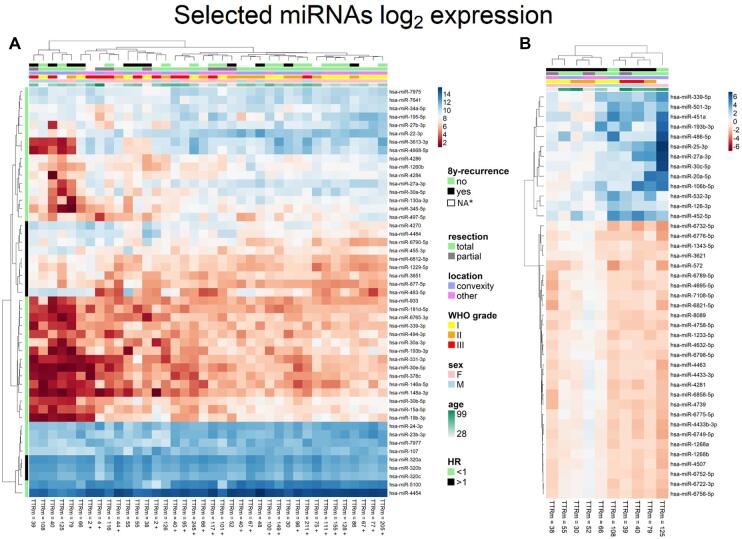
FIGURE 2.
Microarray data. A, Unsupervised hierarchical clustering of 49 differentially expressed miRNAs in MRR+ and MRR− based on logarithmic values (log2) of miRNA’s expression compared to recurrence in 8 yr of follow-up, sex, histopathological grade, type of resection, tumor location, and age at diagnosis. Hazard ratio (HR) is also marked for each miRNA. B, Differentially expressed miRNAs between primary and recurrent samples of MRR+ from paired analyses. TTRm, time to relapse in months; + censored if there is no event during follow-up period; * no evidence of radiographic recurrence, but follow-up <8 yr.

