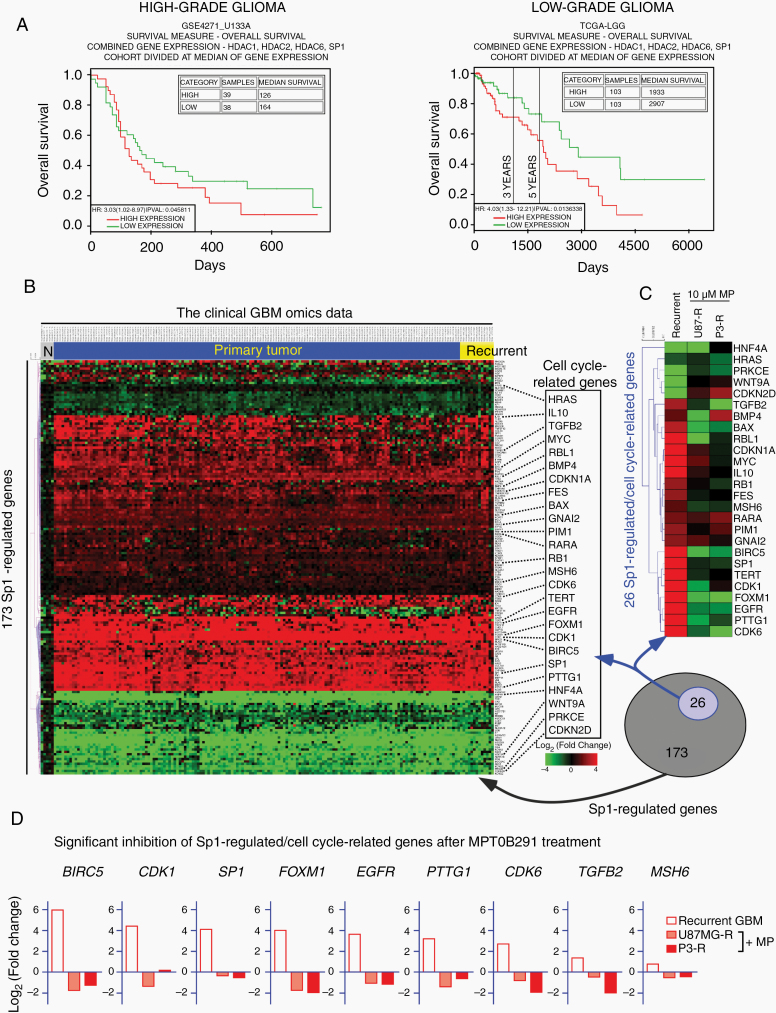
Fig. 6.
The HDAC1/2/6/Sp1 pathway supports GBM pathogenesis and tumor malignancy. (A) Kaplan–Meier survival plots from Phillips et al’s database (GSE4271_U133A, 77 high-grade astrocytomas)35 and from TCGA Brain Lower Grade Glioma database (TCGA-LGG, grades II–III tumors). The gene expression levels of HDAC1/2/6, as well as that of Sp1, were grouped into higher or lower than average (*P < 0.05) groups. (B) Heat map representing the expression levels of 173 Sp1-regulated genes (annotated in Ingenuity knowledge base) in 5 normal brain samples (N), 156 primary tumor, and 13 recurrent tumor samples from TCGA-GBM database (https://portal.gdc.cancer.gov). Compared with the normal brain samples, 26 cell cycle-related genes (based on Gene Ontology annotations) were significantly differentially expressed in recurrent tumors (highlighted in right side). (C) Heat map representing the expression level of 26 Sp1-regulated/cell cycle–related genes in the recurrent GBM tumors and MPT0B291-treated TMZ-R cells. (D) The bar chart further shows the expression profiling (log2 fold change) of 9 significantly downregulated Sp1-regulated/cell cycle–related genes following MPT0B291 treatment.

