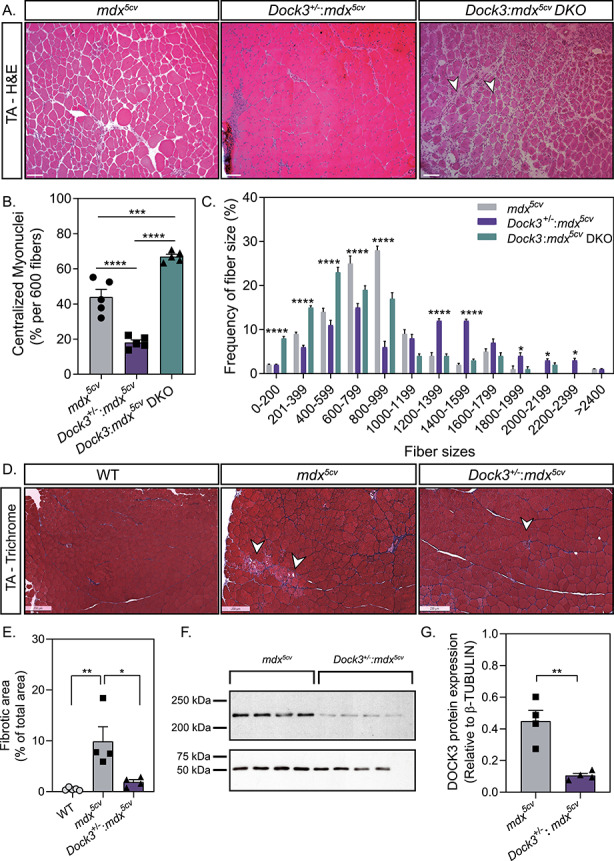
Figure 4.

Gene dosage of Dock3 affects muscle architecture and dystrophic pathology in mdx5cv mice. (A) H&E immunohistochemistry of mdx5cv, Dock3+/−:mdx5cv and Dock3:mdx5cv DKO to visualize muscle morphology. Scale bar = 50 μm. Arrowheads indicate necrotic/fibrotic muscle. (B) Percent of centralized myonuclei out of 600 myofibers/TA comparing Dock3 alleles on mdx5cv genetic background. (n = 5, one-way ANOVA with Tukey’s correction; **P < 0.01, ****P < 0.0001). (C) Comparison of fiber size distribution curve based on CSA (μm2) among Dock3 alleles on mdx5cv genetic background. (n = 5; two-way ANOVA with Tukey’s correction; *P < 0.05, ****P < 0.0001). (D) Masson’s Trichrome stain to visualize fibrotic area in WT, mdx5cv and Dock3+/−:mdx5cv. Scale bar = 250 μm. Arrowheads indicate fibrotic muscle. (E) Percent of fibrotic area comparing WT, mdx5cv and Dock3+/−:mdx5cv TA muscle (n = 4, one-way ANOVA with Tukey’s correction; *P < 0.05, **P < 0.01). (F) Western blot analysis of whole muscle lysate from mdx5cv and Dock3+/−:mdx5cv mice for DOCK3 protein expression level quantification. (G) Quantification of DOCK3 protein expression level (n = 4, student’s t-test, two-tailed, **P < 0.01).
