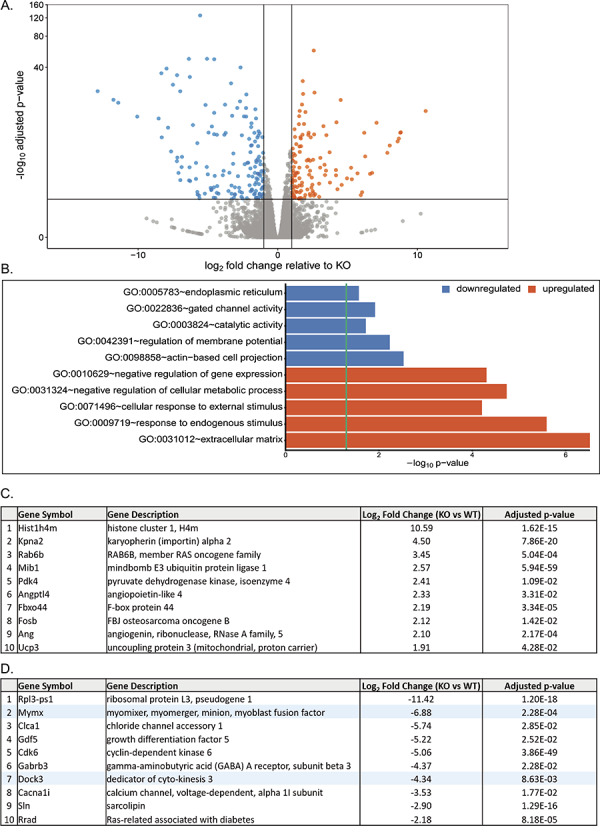
Figure 6.

RNA-sequencing analysis of Dock3 KO TA muscles reveals numerous dysregulated mRNA transcripts and signaling pathways. (A) Summary graph of differentially regulated genes, with blue representing downregulated genes and orange representing upregulated genes relative to KO. (B) Top downregulated and upregulated GO terms as determined by GO analyses compared with WT. (C) Top 10 upregulated genes in Dock3 KO mice compared with WT. (D) Top 10 downregulated genes in Dock3 KO mice compared with WT. Highlighted in blue are specific genes of interest.
