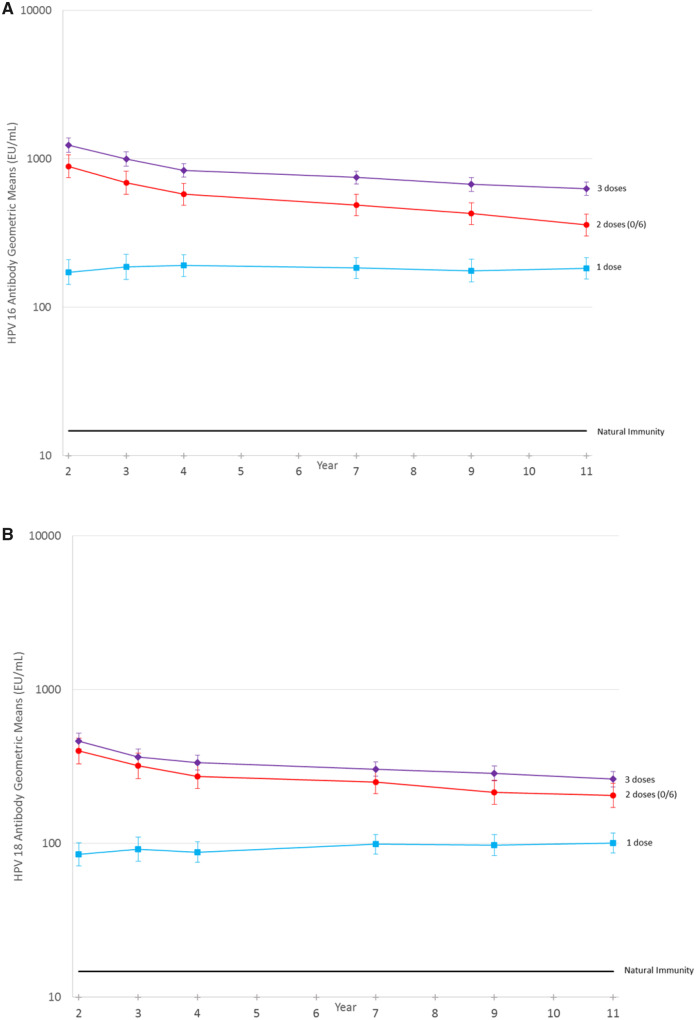
Figure 2.
Human papillomavirus (HPV)16 (graph A) and HPV18 (graph B) antibody levels over time by number of doses received. A linear mixed model using all titer results including replicate testing was used to calculate the Geometric mean titers (GMTs) and 95% confidence intervals (CIs) for single-dose women using continuous time, adjusted by testing batch and using random effects to account for the correlation within a patient and within replicate testing of a visit. For HPV16, the average per-year change in the log titer level for the 221 women with one dose is −0.002 (95% CI = −0.015 to 0.011, P = .72). For HPV18, the average per-year change in the log titer level for the 221 women with one dose is 0.017 (95% CI = 0.005 to 0.029, P = .005).

