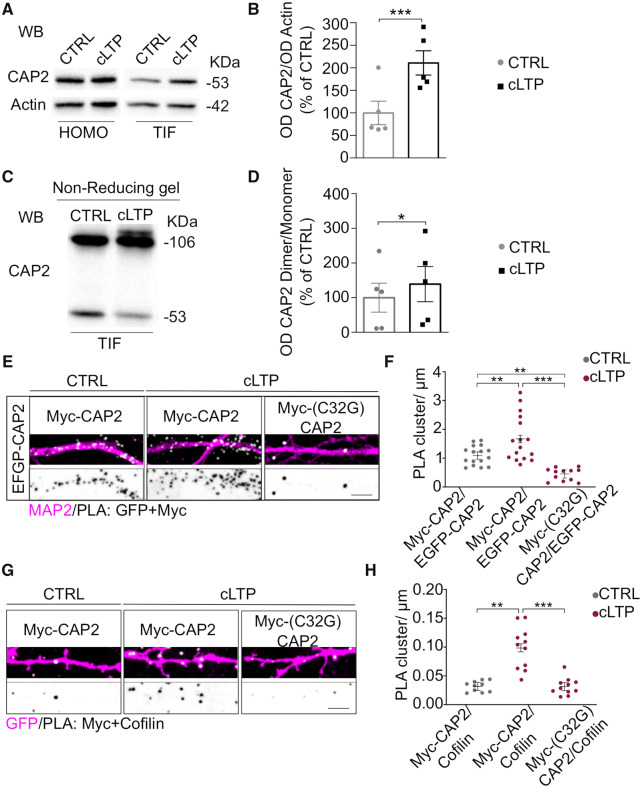
Figure 7.
LTP promotes CAP2 synaptic localization, dimer formation and association with cofilin. (A) Representative WB of CAP2 and actin in Homo and TIF samples obtained from control and cLTP-treated neurons, 30 min after the cLTP induction. Non-cropped blots are shown in Supplementary Fig. 5B and C. (B) cLTP promotes CAP2 enrichment in the TIF (cLTP versus CTRL, paired t-test: ***P = 0.0008, n = 5 independent experiments). (C) Representative WB of CAP2 dimer and monomer in TIF samples obtained from control and cLTP-treated neurons, 30 min after the cLTP induction Non-cropped blots are shown in Supplementary Fig. 5D. (D) cLTP increases CAP2 dimer/monomer ratio in the TIF fraction of cLTP-treated neurons (cLTP versus CTRL, paired t-test: *P = 0.042, n = 5 independent experiments). (E) PLA representative images showing the proximity between EGFP-CAP2 and either Myc-CAP2 or Myc-(C32G)CAP2 (white) along MAP2 positive dendrites (magenta) 30 min after cLTP induction. Lower panels, inverted images of PLA signal (black), scale bar = 5 μm. (F) Graphs show the quantification of the PLA clusters/μm (EGFP-CAP2/Myc-CAP2-CTRL = 1.100 ± 0.128, EGFP-CAP2/Myc-CAP2-cLTP = 1.679 ± 0.128, EGFP-CAP2/Myc-(C32G)CAP2-cLTP = 0.461 ± 0.148, linear mixed-effects model, false discovery rate adjustment for multiple comparisons for the contrasts of interest: **P = 0.00129, ***P < 0.0001, P values for all the multiple comparisons are reported in Table 4; EGFP-CAP2/Myc-CAP2-CTRL n = 16 neurons, EGFP-CAP2/Myc-CAP2-cLTP n = 16 neurons, EGFP-CAP2/Myc-(C32G)CAP2-cLTP n = 12 neurons). (G) PLA images revealing the closeness between cofilin and either Myc-CAP2 or Myc-(C32G)CAP2 (white) along dendrites of GFP transfected hippocampal neurons (magenta) after cLTP induction. Lower panels, inverted images of PLA signal (black), scale bar = 5 μm. (H) Graphs show the quantification of the PLA clusters/μm (MycCAP2/cofilin-CTRL = 0.0317 ± 0.0073, MycCAP2/cofilin-cLTP = 0.0984 ± 0.0070, Myc-(C32G)-CAP2/cofilin-cLTP = 0.0315 ± 0.0070, linear mixed-effects model, false discovery rate adjustment for multiple comparisons for the contrasts of interest: ***P < 0.0001, P values for all the multiple comparisons are reported in Table 4; MycCAP2/cofilin-CTRL n = 10 neurons, MycCAP2/cofilin-cLTP n = 11 neurons, Myc-(C32G)CAP2/cofilin-cLTP n = 11 neurons).

