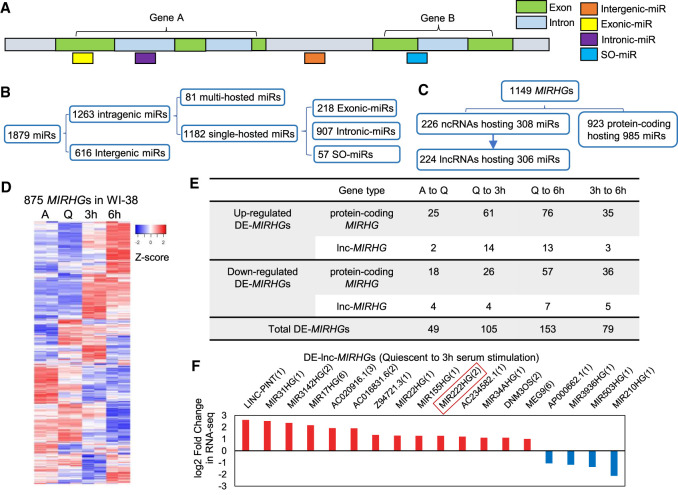
FIGURE 2.
MIRHGs show dynamic expression during cellular quiescence and upon cell cycle reentry. (A) Schematic showing different types of miRNAs (miRs) categorized in this study. Detailed list is available in Supplemental Table S4. (B) Categorization of miRNAs (miRs) in human genome GRCh38 version in terms of their relative locations to host genes (MIRHGs). Detailed list is shown in Supplemental Table S4. (C) Categorization of all identified miRNA host genes (MIRHGs) in human genome GRCh38 version. Detailed list is shown in Supplemental Table S5. (D) Heatmap showing the relative expression levels of 875 MIRHGs that are expressed in WI-38 RNA-seq. Duplicates are represented. Genes (rows of heatmap) are hierarchically clustered using average-linkage clustering method. (E) Table representing the number of differentially expressed MIRHGs (DE-MIRHGs) detected from multiple comparisons between RNA-seq samples. Detailed DE-MIRHG information is available in Supplemental Table S5. (F) Fold change (log2 scale) of 18 DE-lnc-MIRHGs from quiescent to 3-h serum stimulation. Numbers in the parentheses refer to the number of miRNAs encoded within each lnc-MIRHG. See Supplemental Table S5 for detailed DE-lnc-MIRHGs information.

