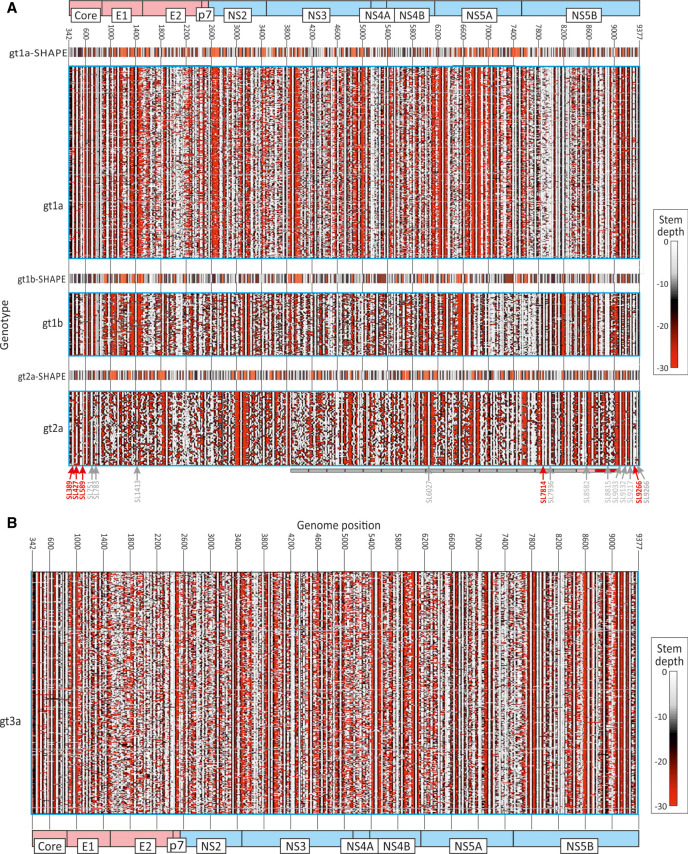
FIGURE 3.
Comparison of RNA structure prediction for HCV genotypes 1a, 1b, 2a, and 3a sequences shown as contour plots. (A) HCV genotypes 1a, 1b, and 2a with SHAPE data; (B) Genotype 3a. Contour plots of RNA structure predictions by RNAFOLD of the coding regions of (A) 388 gt1a, 106 gt1b, 66 gt2a, and (B) 855 gt3a sequences obtained in the current study. Inset plots show RNA structures previously determined for gt1a (H77), gt1b (Con1), and gt2a (JFH1) RNA transcripts by SHAPE (Mauger et al. 2015) plotted to the same scale. The contour plot scale and genome positions of RNA structure elements were converted to those in the H77 (gt1a) prototype sequence (AF011751). Each figure was assembled from graphical output from StructureDist of 13 sequential 1600 base fragments of the alignment incrementing by 400 bases between fragments. The positions of functionally investigated RNA structures of genome segments in previous studies (You et al. 2004; McMullan et al. 2007; Diviney et al. 2008; Chu et al. 2013; Mauger et al. 2015; Pirakitikulr et al. 2016) are indicated by arrows underneath the contour plot of gt2a; numbering and arrows point to the first (5′) bases of the stem–loop. Those showing little or no phenotypic effect on disruption are depicted in gray; those leading to substantial (>1 log) reductions in replication shown in red. Phenotypes of viruses with 17 systematically mutated segments across the NS region (Chu et al. 2013) indicated in gray (no effect), gray (mild effect—segment 16), and red (severe effect—segment 17). These functional depictions are a simplification and interactions between RNA structures with other elements in coding and noncoding regions have been excluded; for this information please consult the original publications.

