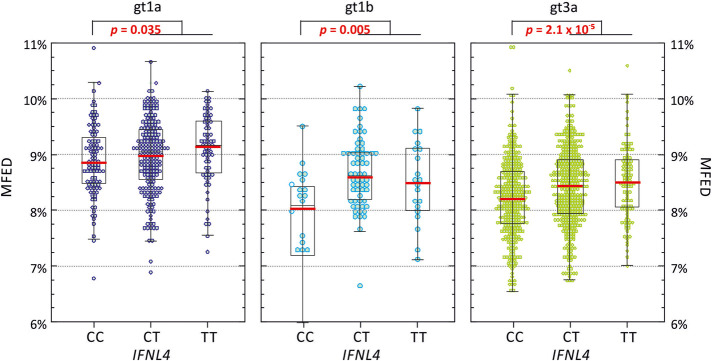
FIGURE 6.
MFED values of gt1a, gt1b, and gt3a genomes recovered from study subjects with different IFNL4 genotypes. MFED values for gt1a, gt1b, and gt3a full genome sequences divided into the IFNL4 genetic background of the host. The box plots show (from the top): 2 SDs above mean, 1 SD above mean, mean (red bar), 1 SD below mean, and 2 SDs below mean. Differences in the distribution of MFED vales were calculated using the Kruskall–Wallace nonparametric test.

