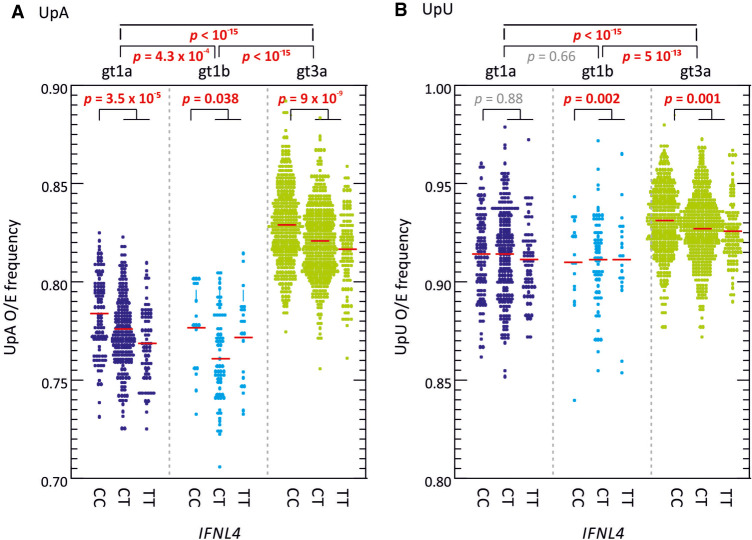
FIGURE 8.
Distributions of UpA and UpU frequencies. Observed to expected frequencies of (A) UpA, and (B) UpU dinucleotides targeted by RNaseL calculated for polyprotein sequence of gts 1a, 1b, and 3a and different IFNL4 alleles. Red bars show mean values; differences in the distribution of O/E ratios were calculated using the Kruskall–Wallace test; significant values shown in red bold type.

