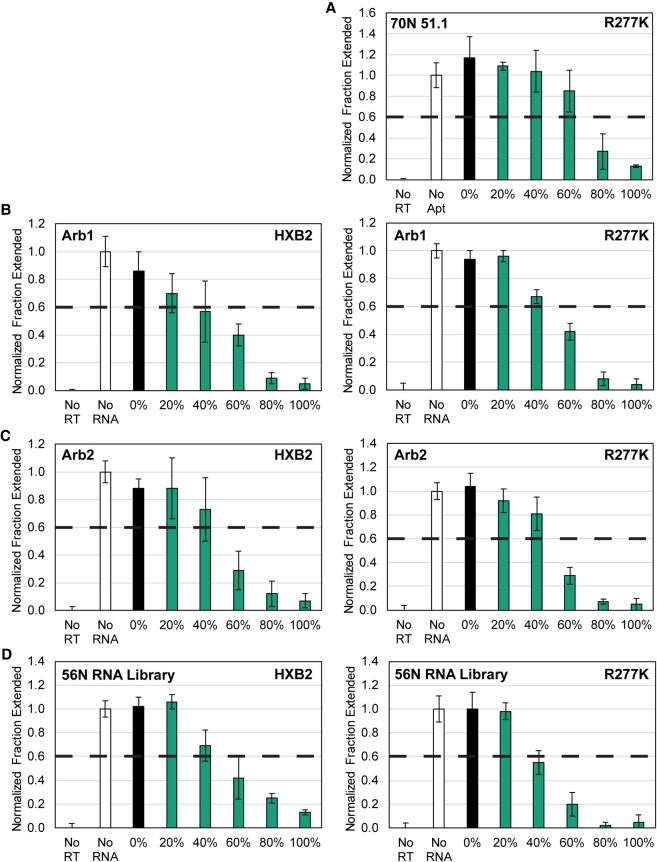
FIGURE 3.
Effect of 2′-FY composition on RT inhibition. RNA sequences indicated in the upper left of each panel were transcribed with the indicated percentages of 2′-FY NTPs present in the transcription reactions and were then tested for RT inhibition (n = 4) of the RT indicated in the upper right of each panel. Data are plotted for (A) F1Pk family aptamer 70N 51.1, (B) Arb1 control, (C) Arb2 control, and (D) 56N random RNA library.

