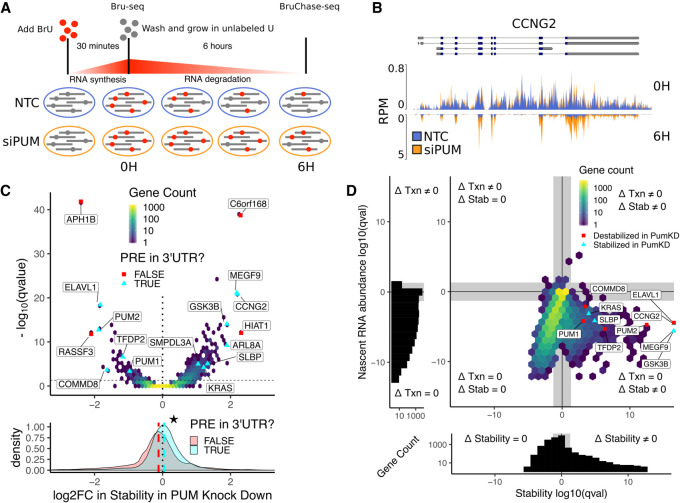
FIGURE 1.
Bru-seq and BruChase-seq allow for determination of PUM-mediated effects on RNA stability. (A) Experimental design for measuring PUM-mediated effects on RNA stability. HEK293 cells incubated for 30 min in the presence of 2 mM BrU prior to time 0. Cells were then washed and cultured in media containing 20 mM unlabeled uridine for 6 h. At 0 h (Bru-seq) and 6 h (BruChase-seq) timepoints, a portion of cells were harvested and BrU labeled RNA was isolated for sequencing. Changes in relative RNA abundance between the 0 and 6 h time points were compared between cells grown in the presence of silencing RNA targeting PUM1 and PUM2 (siPUM) and a nontargeting control siRNA (NTC). Cells were treated with siRNAs for 48 h prior to BrU labeling to allow for PUM depletion. (B) Read coverage traces for CCNG2 as measured in reads per million (RPM) at a resolution of 30 bp over the region shown (chr4:78077800–78092000, hg19). Traces are shown for siPUM (orange) and NTC (blue) conditions at both 0 h (top) and 6 h (inverted bottom) time points. Four replicates for each combination of siRNA and time point are overlaid. Known isoforms for CCNG2 are represented above. (C, top) Volcano hexbin plot displaying global changes in RNA stability under PUM knockdown conditions. The log2 fold change in stability under PUM knockdown conditions compared to the siNTC control after controlling for batch effects is displayed here, where positive values indicate stabilization upon PUM knockdown and negative values indicate destabilization upon PUM knockdown (see Materials and Methods for details). No change in stability is represented with a dotted line at 0. Statistical significance is displayed on the y-axis as the −log10 (FDR-corrected P-value) where larger values indicate a smaller P-value. An FDR-corrected P-value <0.05 is represented with a horizontal dashed line. A selection of genes known to be regulated by PUM (Morris et al. 2008; Bohn et al. 2018) and genes newly identified in this study are labeled. For selected genes only, cyan triangles indicate genes that have a PRE in any annotated 3′-UTR as determined by a match to the PUM1 motif we identified using SEQRS (Fig. 2A). Red squares indicate genes that did not have a PRE in their 3′-UTR. Unlabeled genes are binned into a two-dimensional histogram to avoid overplotting. (Bottom) Marginal distribution of log2FC in stability in PUM knockdown for genes with a PRE in their 3′-UTR (cyan) and genes without a PRE in their 3′-UTR (red). Median values for each distribution are plotted as a dashed line in the appropriate color. The star indicates a statistically significant difference in the median stability as measured by a two-sided permutation of shuffled labels (n = 1000, P < 0.001). (D) Analysis of changes in nascent RNA abundance versus changes in stability. Four separate statistical tests were calculated for each gene: (i) a test for statistically significant changes in RNA stability (Δ Stability ≠ 0), (ii) a test for statistically significant changes in nascent RNA abundance (Δ Txn ≠ 0), (iii) a test for no change in RNA stability (Δ Stability = 0), and (iv) a test for no change in nascent RNA abundance (Δ Txn = 0). Genes are plotted as an (x,y)-coordinate where each coordinate represents the ±log10 (FDR-corrected P-value) of the test with greater evidence (Δ ≠ 0, +log10; or Δ = 0, −log10) for each axis (see Materials and Methods for details). Representative genes displaying a range of stability effects are labeled. Red squares represent genes that were destabilized in PUM knockdown, whereas cyan triangles represent genes that were stabilized in PUM knockdown. All other genes were binned into a two-dimensional histogram. Gray rectangles represent a statistical significance cutoff of Q-value >0.05. (Left, below) Marginal histograms for each axis are plotted with matching gray rectangles to represent the same statistical significance cutoff of Q-value >0.05.

