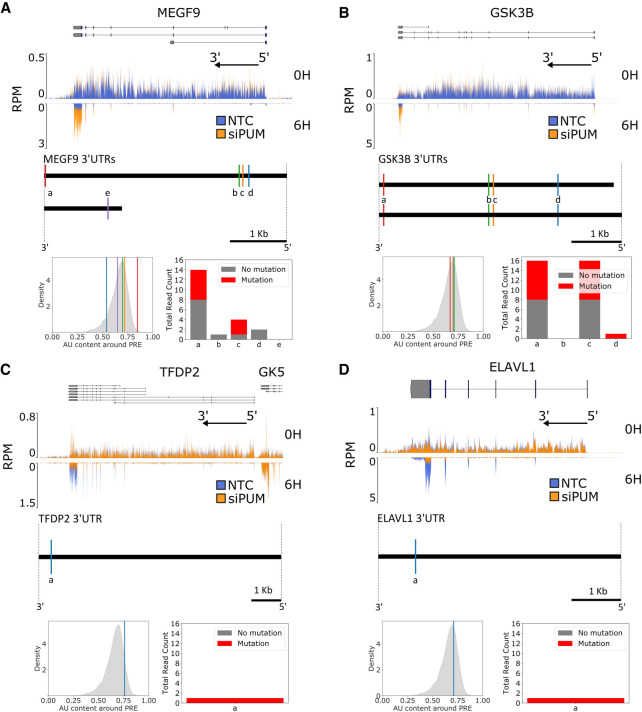
FIGURE 4.
PUM-mediated effects on RNA stability under PUM knockdown include stabilization and destabilization. (A, top) Read coverage traces for MEGF9 and surrounding region (chr9:123348195–123491765, hg19) as measured in reads per million (RPM) at 100 bp resolution. Traces are shown for siPUM (orange) and NTC (blue) conditions at both 0H (upper track) and 6H (inverted lower track) time points. Four replicates for each combination of siRNA and time point are transparently overlaid. Known isoforms for MEGF9 are represented above. The black arrow indicates the direction of the 5′ and 3′ ends of the transcribed RNA molecule from the gene shown. Coverage plots were generated using pyGenomeTracks (Ramírez et al. 2018). N.b. in this and subsequent panels, the appearance of high density in the 3′-UTRs of the 6H samples is simply due to the presence of a small number of peaks that dominate the visualization when shown at the scale of the entire gene; the mean and median density in the 3′-UTR is in fact not substantively different from earlier exons. All sequencing data are available at GEO accession GSE145237. (Below) Diagram of unique MEGF9 3′-UTRs. Sites matching the PUM1 SEQRS motif are represented as vertical lines and labeled alphabetically from 3′ to 5′ for each UTR. (Below left) AU content of a 100 bp window around each PRE labeled above in the overall distribution of surrounding AU content for all PUM1 SEQRS motif matches in the entire set of 3′-UTRs. (Below right) PAR-CLIP read coverage (Hafner et al. 2010) of 40 bp around each indicated PRE. Number of reads with a T → C mutation are shown in red, whereas the number reads with no T → C mutation are shown in gray. (B) As in A, but for GSK3B and surrounding region (chr3:119509500–119848000). (C) As in A, but for TFDP2 and surrounding region (chr3:141630000–141900000). Annotations for the 3′ end of the GK5 gene are included due to their proximity to the TFDP2 5′ end. (D) As in A, but for ELAVL1 and surrounding region (chr19:8015000–8080000).

