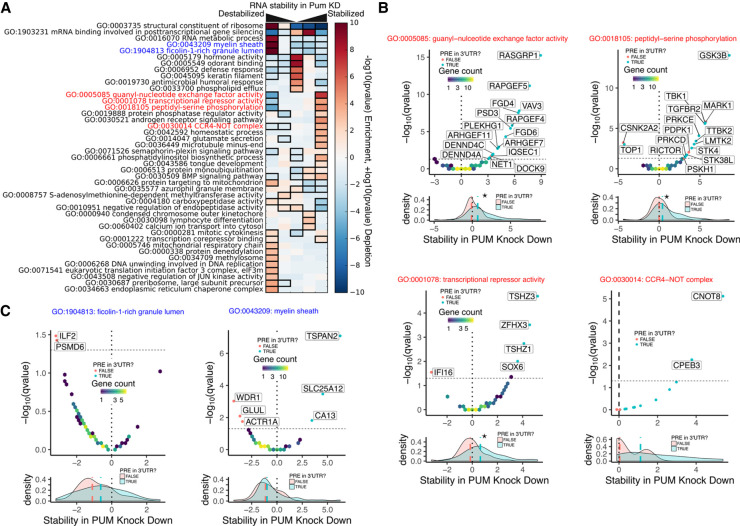
FIGURE 5.
Gene ontology terms associated with PUM-mediated changes in RNA stability. (A) Results of iPAGE analysis to find GO terms sharing mutual information with PUM-mediated effects on RNA stability, discretized into five equally populated bins. Red bins indicate overrepresentation of genes associated with the corresponding GO term. Blue bins indicate underrepresentation of genes associated with the corresponding GO term. A black box indicates a statistically significant over- or underrepresentation with a P-value <0.05 using a hypergeometric test (Goodarzi et al. 2009). Throughout this figure, stability in PUM knockdown is represented by a normalized interaction term between time and condition, where positive values indicate stabilization upon PUM knockdown and negative values indicate destabilization upon PUM knockdown (see Materials and Methods for details). (B) Selected GO terms whose members are overrepresented in the RNAs that are stabilized under PUM knockdown, as labeled in red in A. For each GO term, a volcano plot is shown for all genes within the GO term. Volcano plots are shown as two-dimensional histograms for genes below a statistical significance threshold (Q-value <0.05) and as individual points for genes above the statistical significance threshold. Individual points are blue if a PRE can be found within any annotated 3′-UTR for that gene and red otherwise. The dashed line represents the statistical significance threshold and the dotted line represents no change in RNA stability under PUM knockdown. Below each volcano plot is a marginal density plot for the RNA stability split into two categories within the specified GO term: Genes with a PRE in any annotated 3′-UTR (blue) and genes with no PRE in any annotated 3′-UTR (red). Medians for each distribution are shown as dashed lines in the appropriate color. The black dotted line represents no change in RNA stability, as in the volcano plot above. A star represents a statistically significant (P < 0.05) difference in the medians as tested by a two-sided permutation test of shuffled group labels (n = 1000). (C) As in B, but for selected GO terms whose members are overrepresented in the RNAs that are destabilized under PUM knockdown, as labeled in blue in A.

