FIGURE 6.
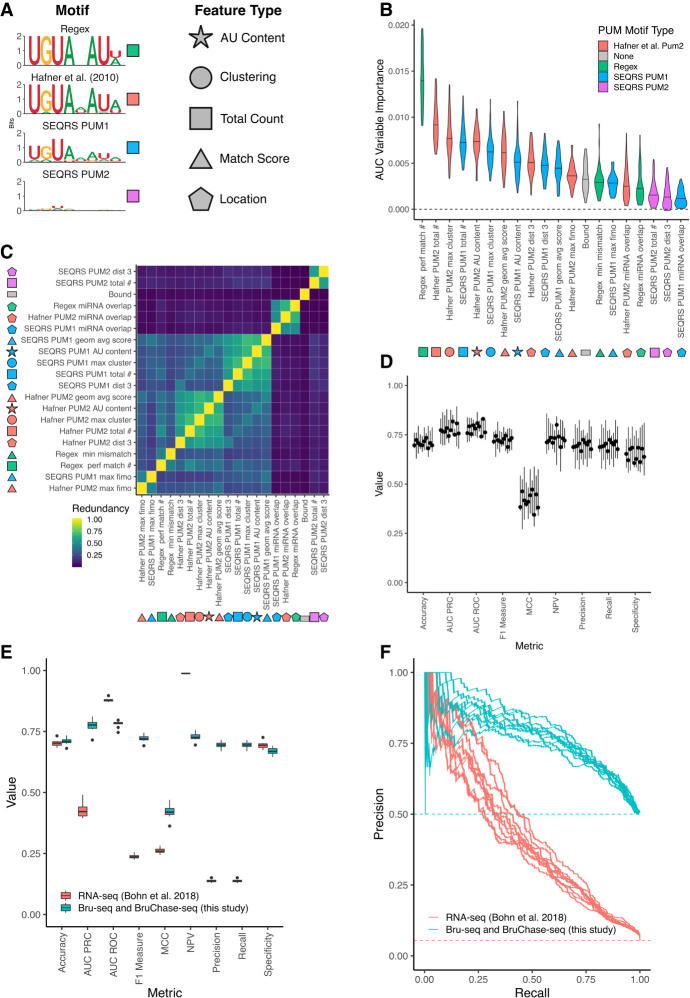
Predicting PUM-mediated effect on decay using both sequence-based and experimental features. (A) Motifs used to calculate features for machine learning. Shapes indicate the type of feature calculated, whereas colors indicate the motif used to calculate those features. Total count is a simple count of motifs; match score refers to a numerical value indicating how well a sequence matches a motif; clustering indicates motif proximity to additional instances of the same motif; location indicates features associated with a single motif's location on the 3′-UTR. Shapes filled in with the appropriate color are used to label features throughout the rest of the figure. (B) Variable importance plot displaying the top 20 most important features, as determined by training a conditional random forest classifier on PUM decay data (see Materials and Methods for details including information on feature names). Violin plots represent density from 10 separate down-samplings of the majority class, each with fivefold cross-validation. An AUC-based variable importance measure is used as described in Janitza et al. (2013). (C) Calculation of the redundancy in information between the top 20 most important variables, as determined in A. Redundancy is calculated in the information-theoretic sense (see Materials and Methods for details) where 1 is completely redundant information and 0 is no redundancy in information between the two variables. (D) Cross-validation of conditional random forest classifier performance. Each boxplot represents a separate down-sample of the majority, no PUM-mediated effect class. Values for each boxplot represent the performance metric as calculated for each of fivefolds using a classification cutoff of 0.5. (E) Performance of conditional random forest models. Blue boxplots represent values from separate down-samplings of the majority, no PUM-mediated effect class used to train the model on the Bru-seq and BruChase-seq data set. Red boxplots indicate values from testing each model on the Bohn et al. (2018) steady-state RNA-seq data set. Metrics were calculated using a classification cutoff of 0.5. (F) Precision recall curves using the models in E. Each line represents one of 10 conditional random forest models trained on separate down-sampled sets of the entire Bru-seq and BruChase-seq data set and tested on the steady-state RNA-seq data set.

