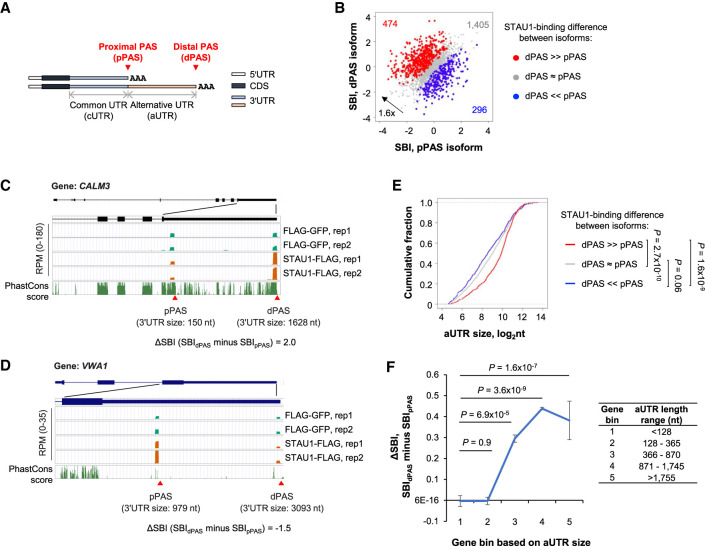
FIGURE 4.
STAU1 binds APA isoforms with different affinities. (A) Schematics showing two alternative polyadenylation (APA) mRNA isoforms, that is, a proximal PAS (pPAS) isoform with a short 3′UTR, and a distal PAS (dPAS) isoform with a long 3′UTR. Common 3′UTR (cUTR) and alternative 3′UTR (aUTR) regions are indicated. (B) Scatter plot comparing the SBI of pPAS isoforms (x-axis) versus dPAS isoforms (y-axis). Red dots, genes whose dPAS isoform has a significantly higher SBI than its pPAS isoform. Blue dots, genes whose pPAS isoform has a significantly higher SBI than its dPAS isoform. Gray dots, genes whose dPAS and pPAS isoforms have similar SBIs. Significance of difference was based on P < 0.05 (DEXSeq) and fold change >1.2. (C) The CALM3 gene encodes a dPAS isoform with a higher SBI than its pPAS isoform. UCSC Genome Browser tracks are shown. 3′UTR sizes for the two isoforms are indicated. Genomic sequence conservation based on PhastCons scores derived from 100 vertebrate species is shown in the bottom-most strip. (D) As in panel C, except that the pPAS isoform encoded by the VWA1 gene has a higher SBI than the dPAS isoform. (E) Cumulative fraction function curves of aUTR sizes for three groups of genes (red, gray, and blue genes corresponding to those in panel B). P-values (K–S test) indicating significance of difference between gene groups are shown. (F) Mean ΔSBI between dPAS and pPAS for APA isoforms in different aUTR-size bins. Genes were evenly divided into five groups based on aUTR size (indicated in the table next to the graph).

