FIGURE 5.
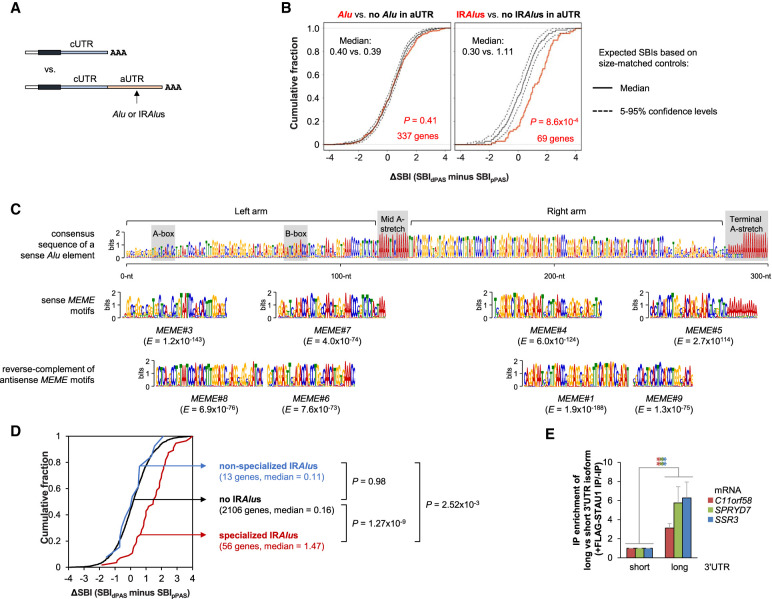
Specialized IRAlus in alternative 3′UTRs lead to differential binding of STAU1 to different 3′UTR isoforms. (A) Schematic of SBI analysis using APA isoforms. The longer 3′UTR isoform with an Alu or IRAlus in its aUTR is compared to the shorter 3′UTR isoform. (B) Cumulative distribution function curves of ΔSBIs for gene transcripts having any number of Alus in the same orientation (left) or IRAlus (right) in their aUTRs, as illustrated in panel A. ΔSBI for each gene's transcripts is based on the SBI difference between the longer 3′UTR isoform and the shorter 3′UTR isoform. The two most abundant APA isoforms deriving from each gene were used for analysis. Observed values were compared to expected values calculated using aUTR size-matched controls. (C) Alignment of STAU1-binding MEME motifs with a consensus Alu element. Top, consensus sequence of a sense Alu element. Bottom, sense or antisense MEME motifs aligned to corresponding regions. Gray boxes indicate key features of an Alu element. The E-value (statistical value of a motif based on the log likelihood ratio, width, sites, the background letter frequencies, and the size of the training set) of each MEME motif is indicated. (D) Cumulative distribution function curves of the differential SBI of alternative APA mRNA isoforms classified based on their aUTR-bearing IRAlus and/or STAU1-binding MEME motifs. P-values (K–S test) indicating significance of difference between gene sets are indicated. (E) Histogram representation of RT-qPCR quantification of mRNAs whose aUTR promotes STAU1 binding and harbors a specialized IRAlus. RNA abundance after anti-FLAG immunoprecipitation (IP) of lysates of STAU1-KO HEK293T cells transiently expressing FLAG-STAU1, relative to abundance after anti-FLAG IP of lysates of STAU1-KO HEK293T cells expressing GFP-FLAG, were normalized to abundance before IP. Values depicting FLAG-STAU1 binding to the short isoforms are set to 1. Results are means ± SD. n = 3. (**) P < 0.01 by a two-tailed unpaired Student's t-test. Experimental design is detailed in Supplemental Figure S5D.

