FIGURE 6.
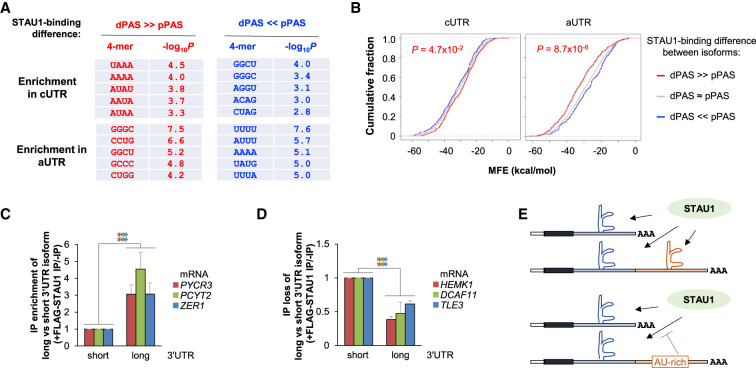
RNA sequence and structure features beyond IRAlus play roles in differential binding of 3′UTR isoforms to STAU1. (A) Top enriched tetramers (4-mers) in the cUTRs or aUTRs of different gene groups. Two groups of genes were analyzed for 4-mer enrichment in their cUTRs and aUTRs, that is, genes whose pPAS isoform has a higher SBI than its dPAS isoform (blue genes in Fig. 4B), and genes whose dPAS isoform has a higher SBI than its pPAS isoform (red genes in Fig. 4B). (B) Cumulative fraction function curves of minimum free energy (MFE) by Mfold analysis predicting the stability of RNA structures in the cUTRs or aUTRs of the three gene groups defined in Figure 4B. P-value (K–S test) indicating the significance of the difference between red genes (red line) and blue genes (blue line) is indicated. (C,D) RT-qPCR quantitation of mRNAs whose aUTR promotes (C) or inhibits (D) STAU1 binding. Experimental design is as in Figure 5E and detailed in Supplemental Figure S5D. mRNAs analyzed in C harbor predicted GC-rich secondary structures in their aUTR, whereas those in D contain sequences that reduce STAU1 binding, including U-rich (HEMK1), A-rich (DCAF11), or U-rich and A-rich (TLE3) motifs. (E) Schematic summarizing the sequence and structure analysis results.

