
Figure 1.
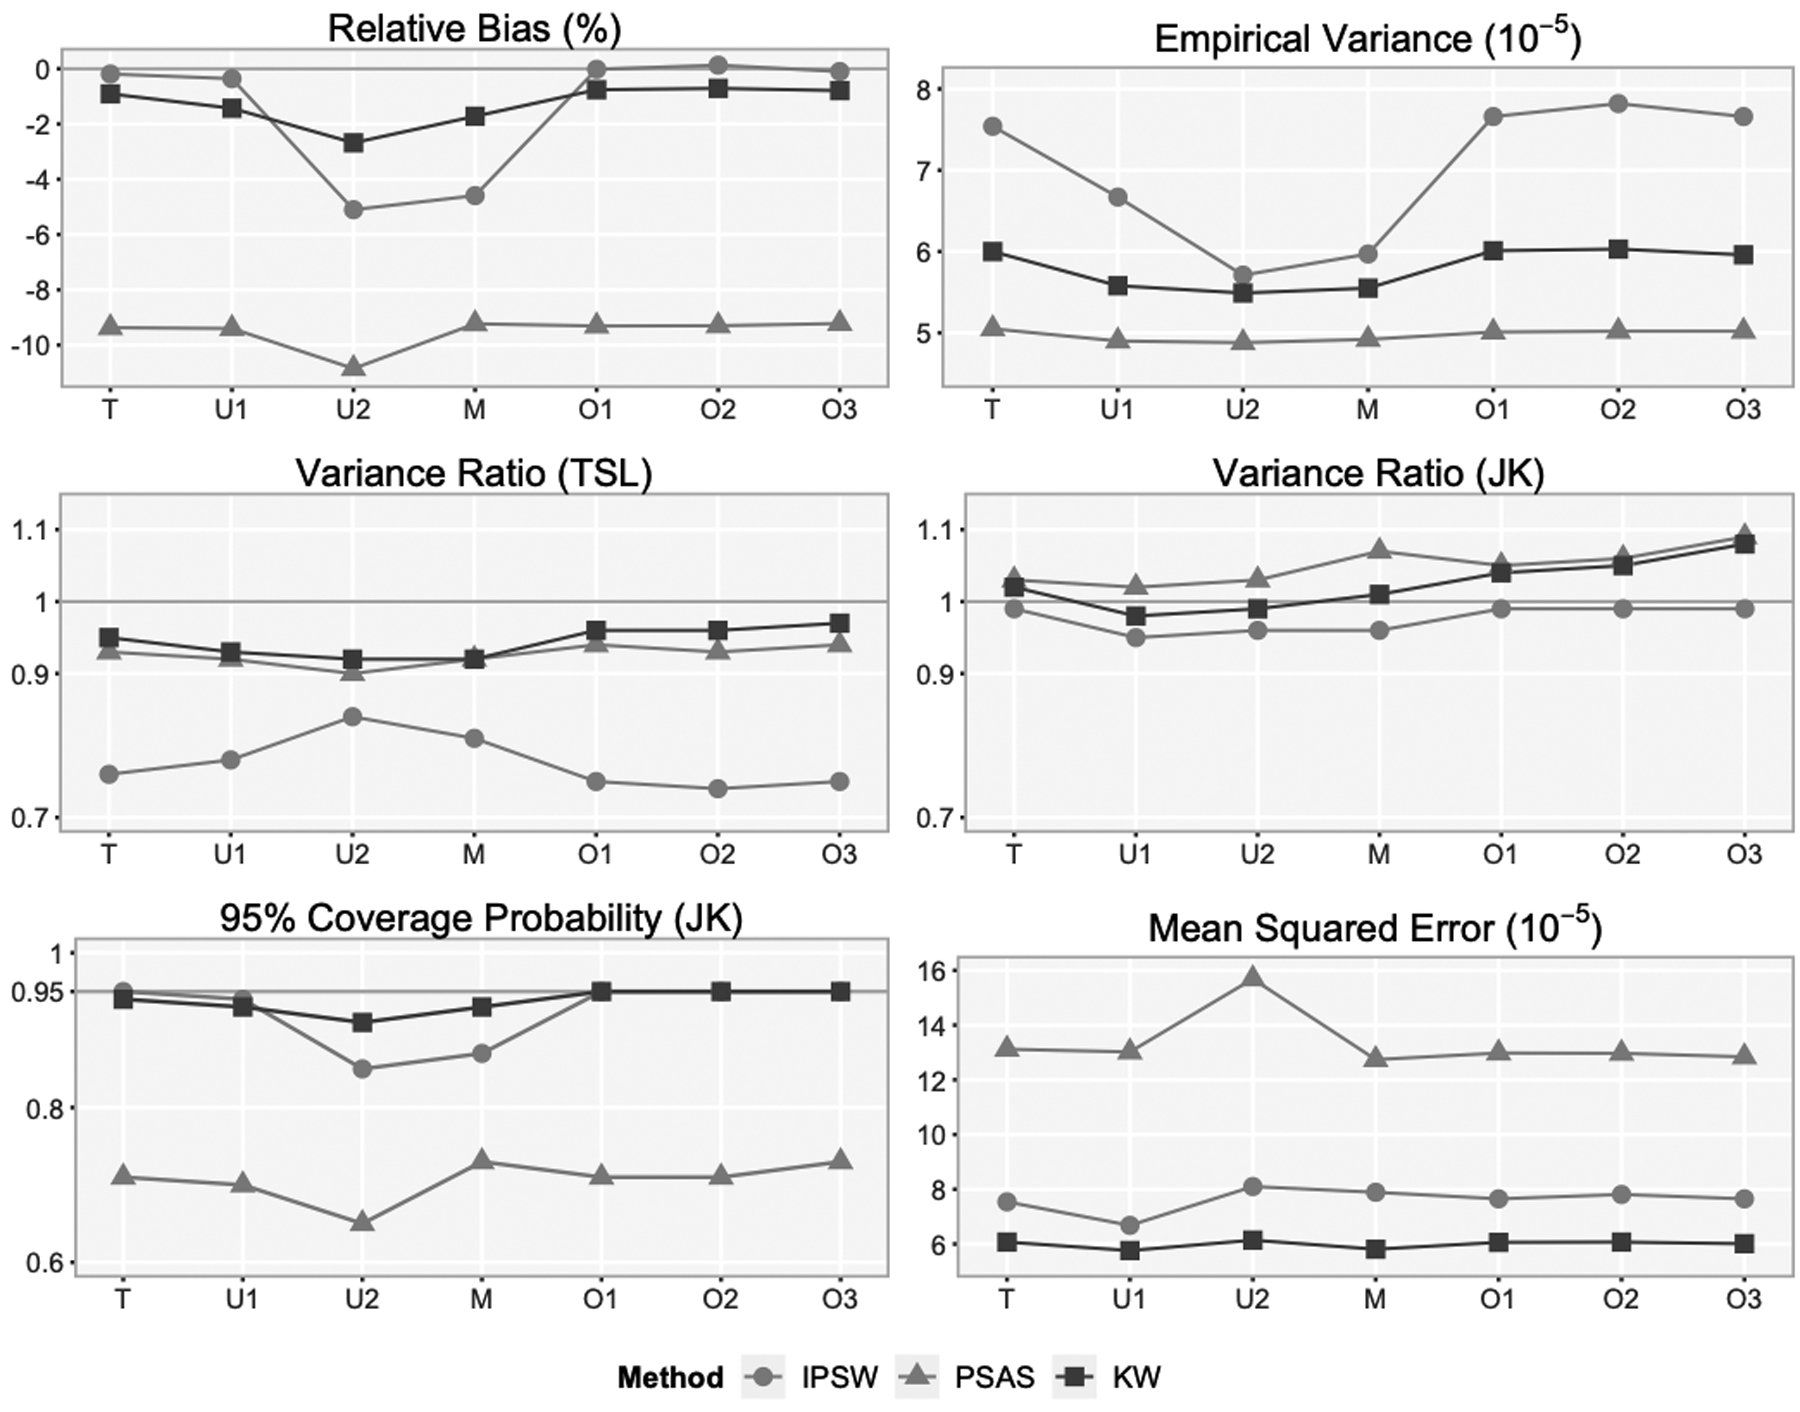
Simulation results from 1,000 simulated cohorts and survey samples with each cohort and survey sample fitted to the correct propensity model and six misspecified propensity models†.
†The true model (T) is logit{p(x)} ~ age, hh_inc, Env, z. The misspecified models are underfitted model (U1) logit{p(x)} ~ age, Env, z; underfitted model (U2) logit{p(x) ~ ag, Env; model (M) logit{p(x)} ~ age, Env, Hisp, sex; overfitted model (O1) logit{p(x)} ~ age, hh_inc, Env, z, Hisp; overfitted model (O2) logit{p(x)} ~ age, hh_inc, Env, z, Hisp, sex; and overfitted model (O3) logit{p(x)} ~ age, hh_inc, Env, z, urb.