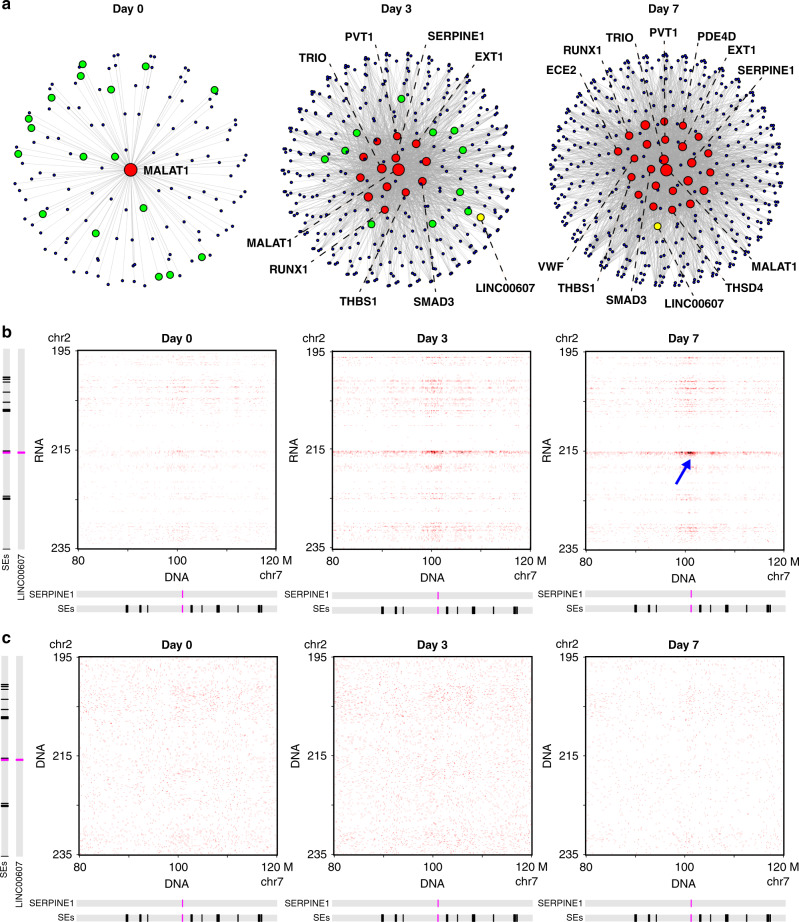
Fig. 3. Hub SEs induced by H + T contain driver genes of EC dysfunction.
a Interchromosomal RNA–chromatin interaction networks. Each node is a SE. Each edge is an interchromosomal interaction between two SEs. Red nodes: hub SEs. Green nodes: SEs that became hub SEs at the next time point. Yellow node: Linc607SE. The SEs that contain EC dysfunction-related genes are marked with the gene name. b, c Contact matrices between chromosome 2 (195–235 Mb) and chromosome 7 (80–120 Mb). b iMARGI derived contact matrices from the RNA (rows) to DNA (columns) in Days 0 (left), 3 (middle), and 7 (right) ECs. Blue arrow: interactions between Linc607SE and Serpine1SE established at Day 7. c Hi-C derived contact matrices. Locations of SEs, LINC00607, and SERPINE1 are marked on the left and at the bottom. Resolution = 200 kb.

