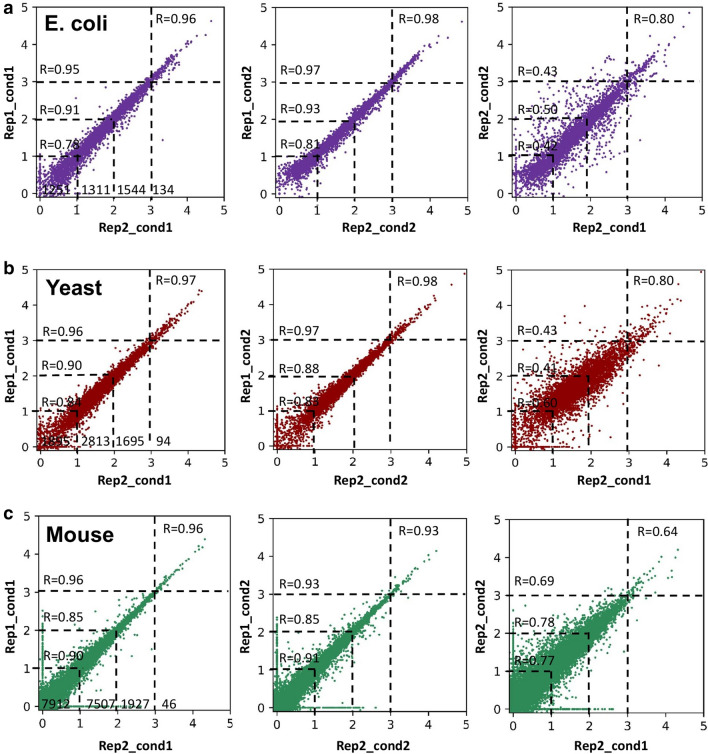
Figure 1.
Transcriptome-wide expression scatter. (a) E. coli (purple), (b) S. cerevisiae (burgurdy), and (c) mouse embryonic stem cell (ESC) derived from blastocysts (green) gene expression scatter between 2 replicates at anchor condition (t = 0) for E. coli and S. cerevisiae, and control condition for mouse ESC, (denoted as cond1, left panel); between 2 replicates at target condition for E. coli (t = 10 min) and S. cerevisiae (t = 240 min), and Etomoxir treated condition for mouse ESC, (denoted as cond2, middle panel); between anchor and target condition (right panel).

