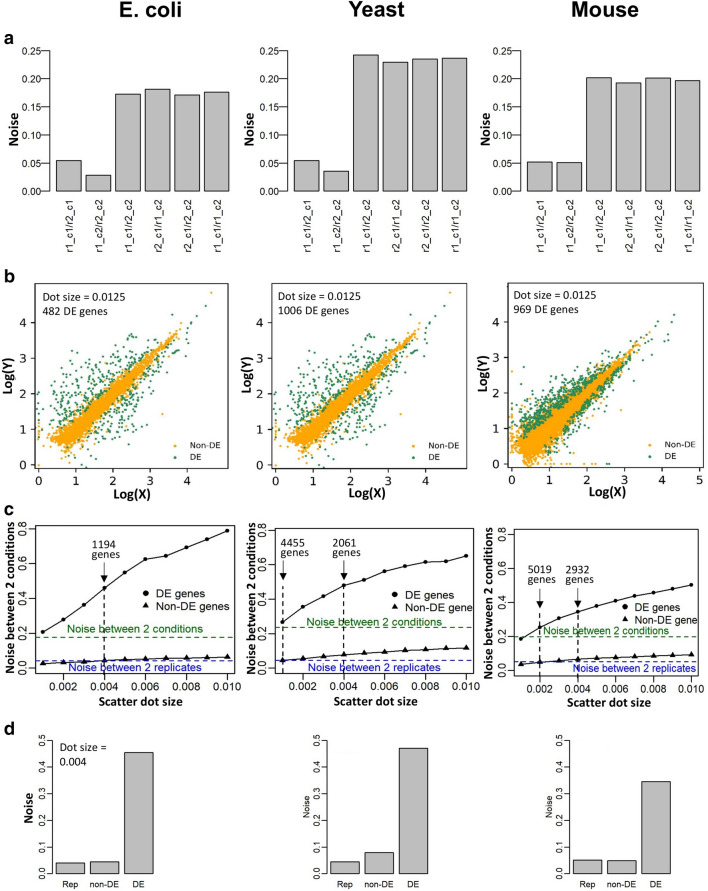
Figure 2.
Transcriptome-wide expression noise as an indicator for differential expressions. (a) Expression noise between 2 replicates at the same time point (between replicate 1 and replicate 2 of condition 1, denoted as r1_c1/r2_c1 and between replicate 1 and replicate 2 of condition 2, denoted as r1_c2/r2_c2) and between anchor and target conditions in 4 combinations of 2 replicates and 2 conditions, after the removal of lowly expressed genes (Fig. S1). (b) Distinction between differentially expressed (DE) genes (green) and non-DE genes (orange) by overlaying expression scatter between 2 conditions and 2 replicates at all conditions in E. coli (left panel), S. cerevisiae (middle panel), and mouse ESC (right panel). (c) Expression noise between anchor and target time points due to DE genes (filled circle) and non-DE genes (filled triangle) with scatter dot size ranging from 0.001 to 0.01 log10(TPM)) in E. coli (left panel), S. cerevisiae (middle panel), and mouse ESC (right panel). Scatter dot size at 0.004 log10(TPM) for E. coli, 0.001 log10(TPM) for S. cerevisiae, and 0.002 log10(TPM) for mouse ESC resulted in non-DE gene set whose expression noise between anchor and target time points is comparable to the averaged whole-transcriptome noise between 2 replicates (dashed blue line). The most conservative dot size of E. coli, 0.004 log10(TPM) was applied for all cell types. (d) Expression noise at scatter dot size 0.004 for transcriptome-wide replicates (Rep), non-DE and DE genes between 2 different conditions.

