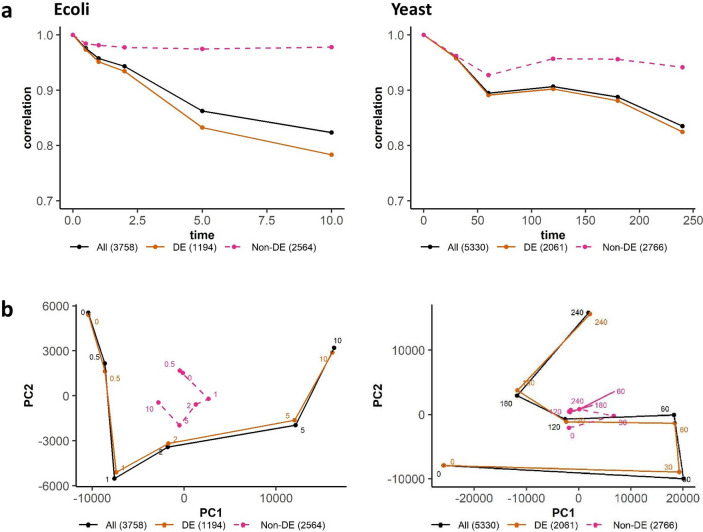
Figure 3.
Auto-correlation and principal component (PC) analysis of whole transcriptome, DE genes and non-DE genes. (a) Pearson correlation and (b) Gene expression trajectory on PC1-PC2 space between time t0 (0 min) and ti (0, 0.5, 1, 2, 5, 10 min for E. coli – left panels) and 0, 30, 60, 120, 180, 240 min for S. cerevisiae – right panel) of whole transcriptome (solid black), DE genes at scatter dot size 0.004 log(TPM) (solid orange), and non-DE genes (dashed pink). The PC trajectories were obtained by taking the average trajectories of 2 replicates. The first 2 PCs account for 91.76% total variance in E. coli and 80.25% in S. cerevisiae.

