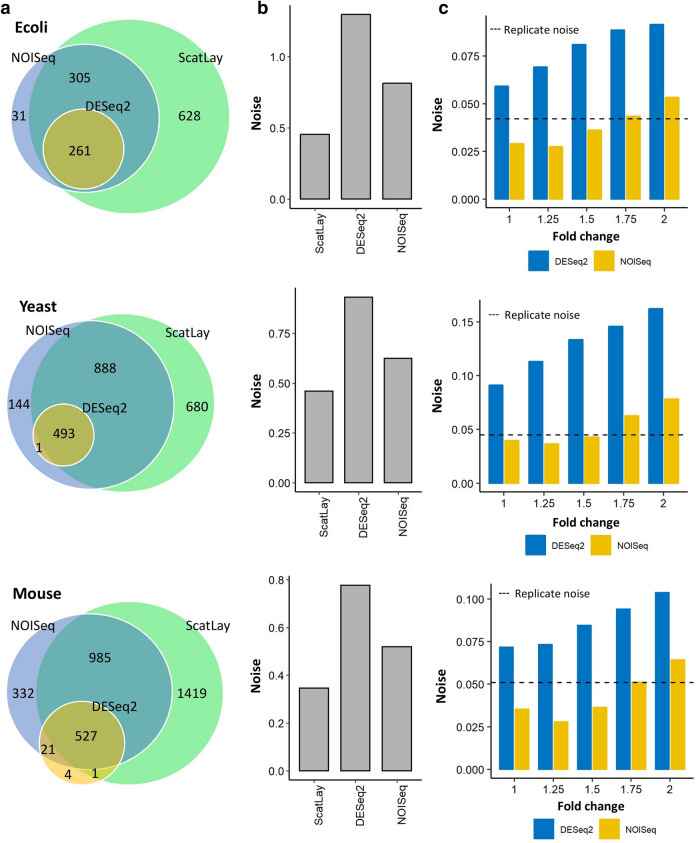
Figure 4.
Comparison of DE genes by ScatLay, DESeq2, and NOISeq. (a) Number of DE genes detected by ScatLay at dot size 0.004 (green), DE genes detected by DESeq2 (dark yellow) and NOISeq (light purple) methods with expression fold change above 2 and adjusted p value below 0.05 for E. coli (top panel), S. cerevisiae (middle panel), and mouse ESC (bottom panel). (b) Expression noise due to the respective DE genes detected by ScatLay, DESeq2 and NOISeq. (c) Averaged expression noise between 2 time points due to the non-DE genes detected by DESeq2 (blue) and NOISeq (yellow) with expression fold-change threshold varying from 1.0 to 2.0, with adjusted p value below 0.05, in comparison to whole-transcriptome noise between replicates of the same condition (dashed line). Non-DE noise level by NOISeq method at 1.75-fold threshold for E. coli (top panel) and mouse ESC (bottom pabel), and 1.5-fold threshold for S. cerevisiae (middle panel) are similar to the replicate noise level. With p value cut-off at 0.05, DESeq2 non-DE genes show higher noise value than replicate noise at every fold change threshold. For DESeq2, p-value was raised to 0.25 to attain similar noise level of non-DE genes with replicate noise.

