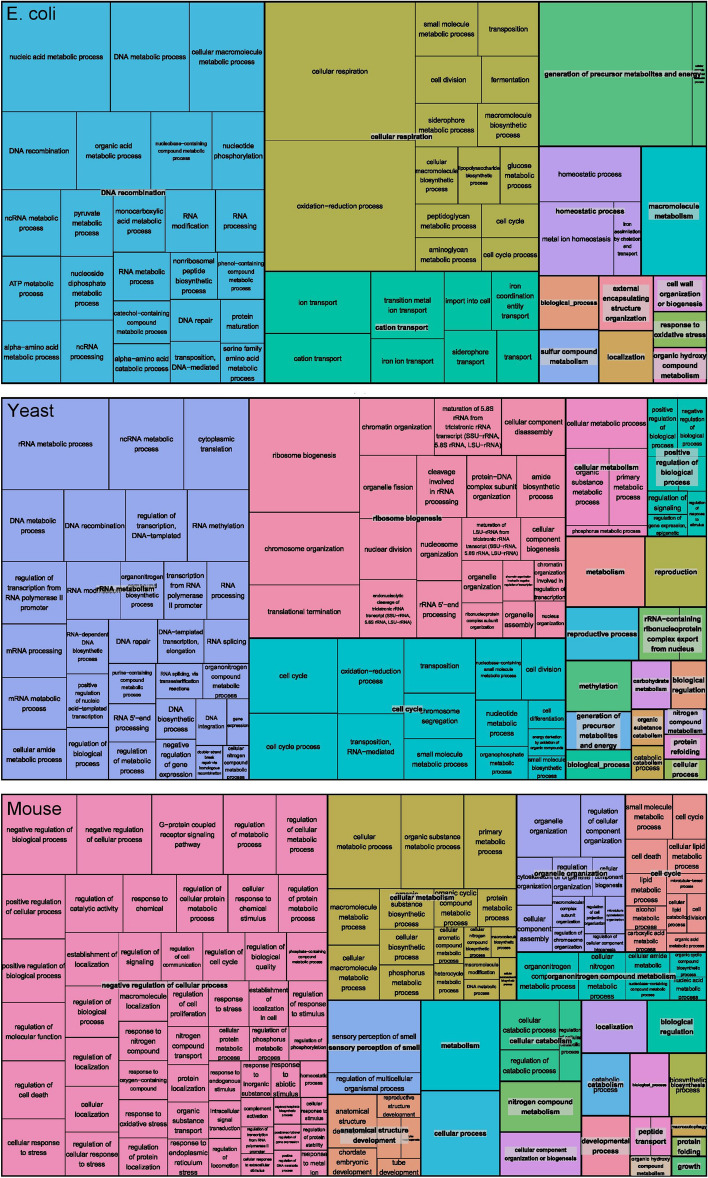
Figure 5.
Enriched gene ontology of DE genes detected by ScatLay at scatter dot size 0.004 log10(TPM) and p value threshold at 0.05 for E. coli (top panel), S. cerevisiae (middle panel), and mouse ESC (bottom panel). Enrichment analysis were first retrieved from Gene Ontology Consortium with defaulted over-representation test parameters, and then refined and visualized by REVIGO tool32. The full list of enriched gene ontology terms is shown in Table S3.

