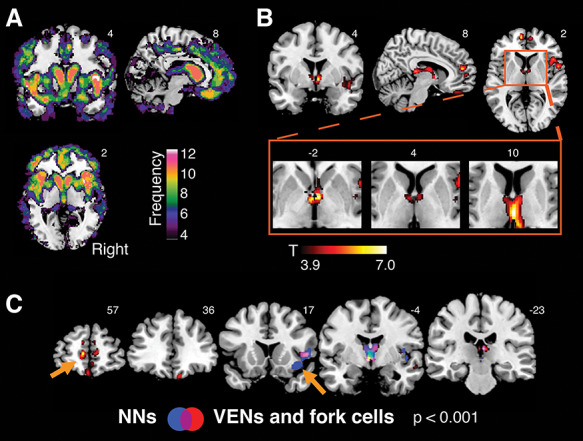
Figure 2.

Gray matter atrophy associated with the rate of TDP-43 inclusion-bearing VENs and fork cells in right FI. (A) Brain atrophy in ALS/bvFTD spectrum. Voxel-wise frequency map of gray matter atrophy using W-score maps of all patients. Individual W-score gray matter maps were binarized at a W-score threshold of 2 and summed, such that a higher score at each voxel indicates a larger proportion of subjects with suprathreshold atrophy. Only voxels in which at least 4 patients had a W-score > 2 are shown. (B) Gray matter atrophy associated with the rate of TDP-43 inclusion-bearing VENs and fork cells in right FI was observed in medial frontal, right insular, subcortical, limbic, and dorsomedial thalamic sites. A cluster in anterior limbic areas is seen in the region of the bed nucleus of the stria terminalis, and subcortical areas span posteriorly into the dorsomedial and medial pulvinar thalamic nuclei. Voxel-wise analyses were corrected for C9orf72 mutation status and the interval between MRI scan and death. (C) Atrophy patterns associated with TDP-43 inclusion formation in VENs and fork cells (in red) versus layer 5 neighboring neurons (in blue) of the right FI. The overlap of both patterns (violet) reveals substantial overlap in right insula and thalamus. Notable differences (orange arrows) include gray matter atrophy in medial frontal regions, including the anterior cingulate cortex, specifically associated with inclusion formation in VENs and fork cells. In contrast, gray matter atrophy of the right FI (where neuron counting was performed) was more associated with inclusion formation in neighboring layer 5 neurons. Voxel-wise analyses were performed with a height threshold of P < 0.001 and a cluster-extent threshold of P < 0.05 FWE, corrected. NNs = layer 5 neighboring neurons.
