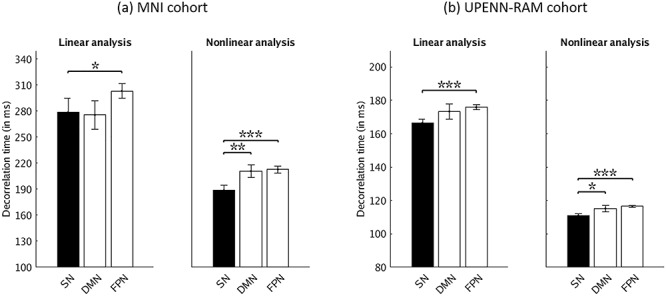
Figure 5.

Decorrelation times of iEEG activity in SN, compared to DMN and FPN electrodes using both linear and nonlinear analysis. (a) MNI cohort. (b) UPENN-RAM cohort. Decorrelation time, the interval in which past “memory” in the time series is lost, was determined using both linear and nonlinear measures. In linear analysis, SN electrodes had shorter decorrelation times in comparison to the FPN electrodes in both cohorts. In nonlinear analysis, SN electrodes had shorter decorrelation times in comparison to the DMN and FPN electrodes in both cohorts. Error bars denote standard error of the mean (SEM) across all electrodes. ***P < 0.001, **P < 0.01, *P < 0.05 (Mann–Whitney U-test).
