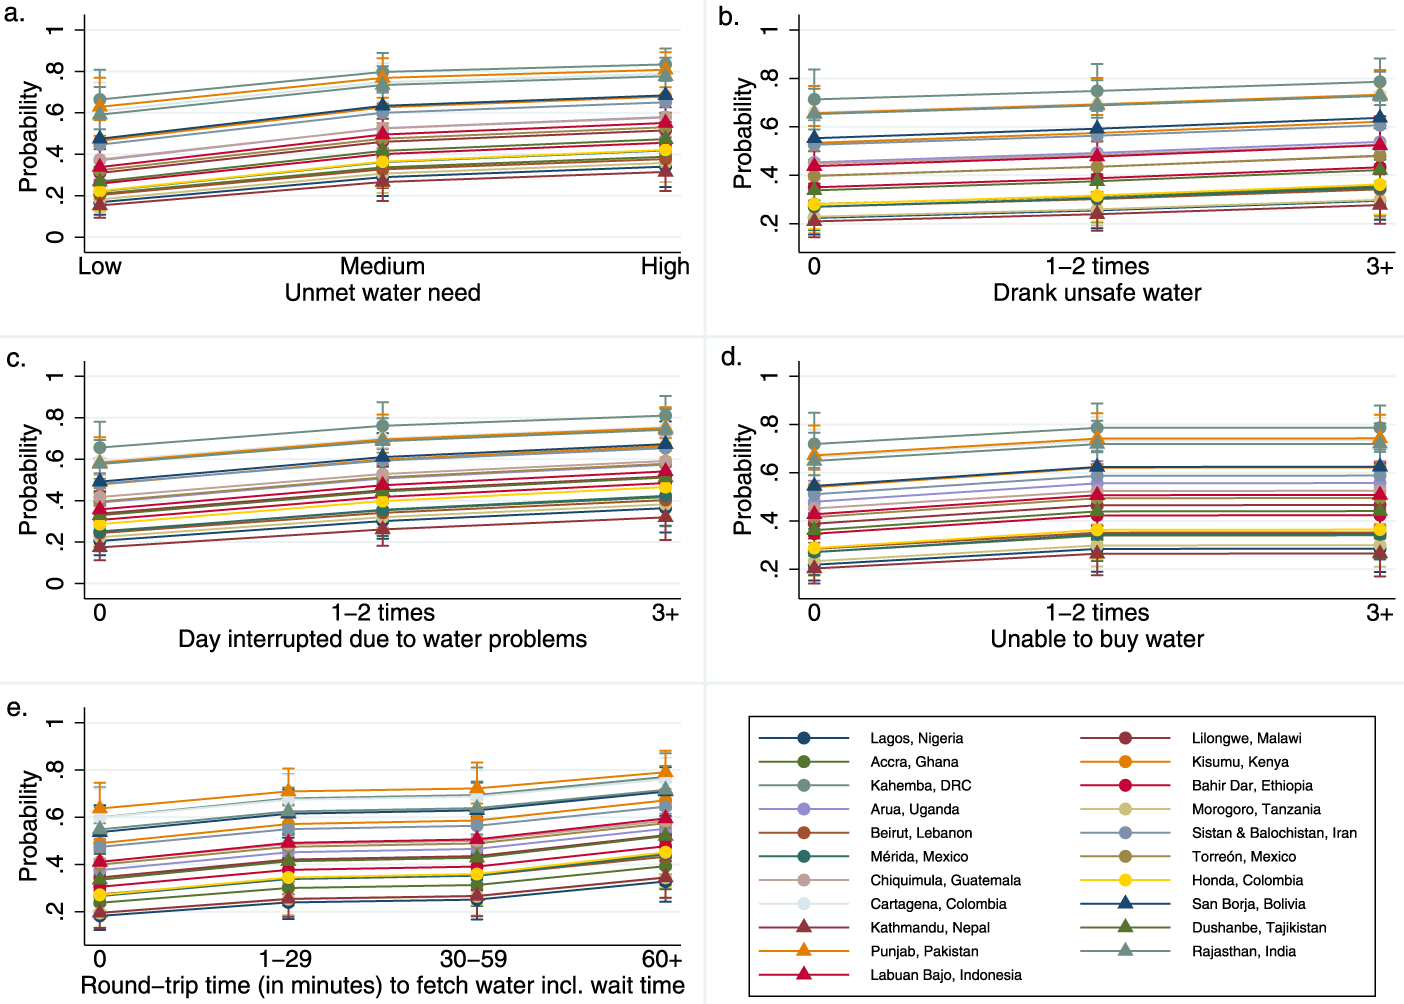
Fig. 5.

Predicted probability and 95% confidence intervals of borrowing water by a) unmet water need tertiles; b) drank unsafe water; c) interruptions of the day’s activities; d) inability to purchase water; e) time to fetch water; all calculated within sites. Notes: Figures generated using marginal standardization adjusted for unmet water need, water safety, daily water interruptions, inability to purchase water, round-trip time to fetch water, and perceived SES, season, urbanicity, sex of household head, whether household had 5 L or more per person in drinking water stored, whether household used an improved water source, age, and age-squared. N = 4,417 in 21 sites. Values for all 5 figures shown in SI Appendix, Tables S3–S7.
