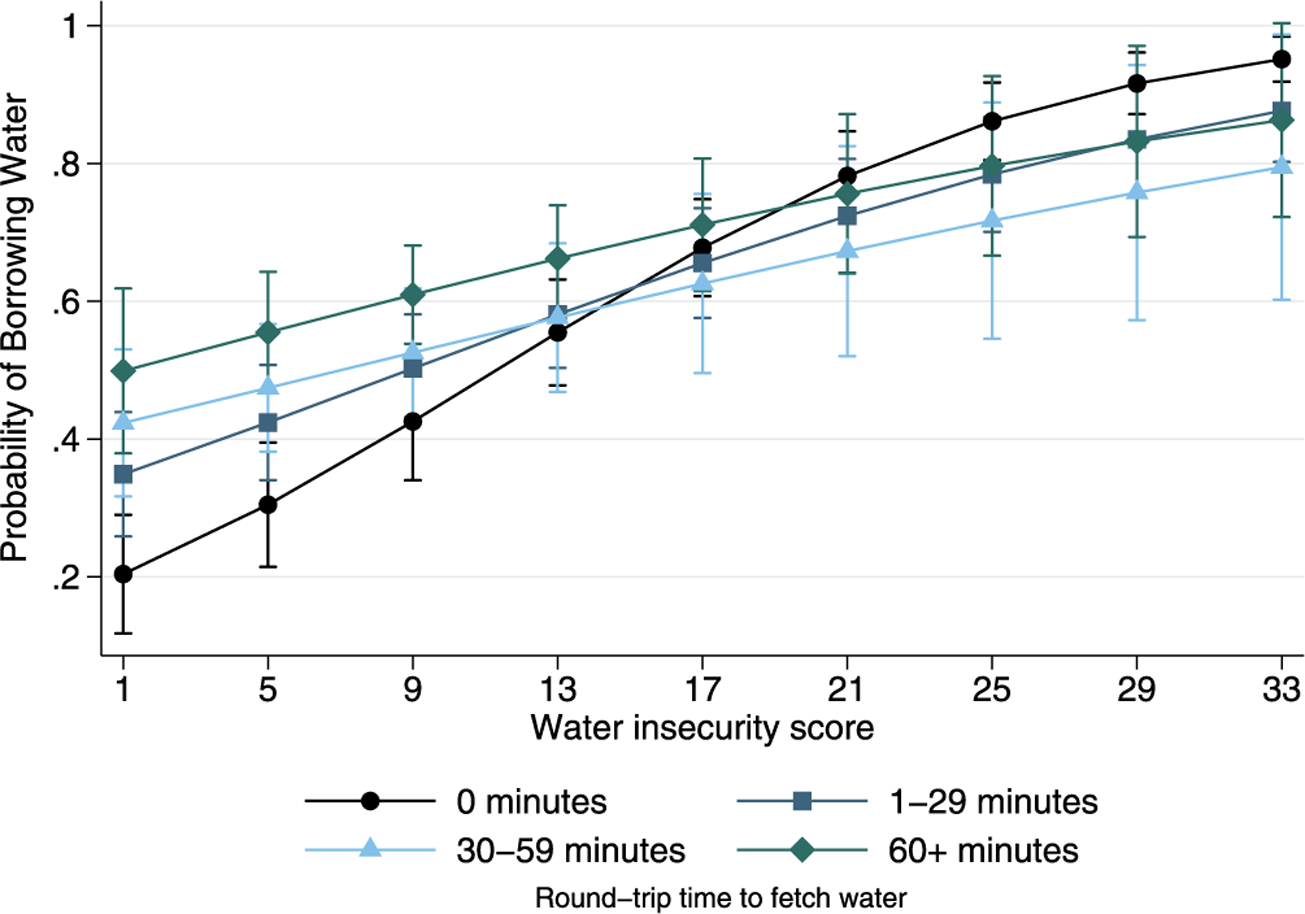
Fig. 7.

Predicted probability and 95% confidence intervals of borrowing water as reflected by interaction between time to water source and household water insecurity score. Notes: Figure generated from model 2 in Table S9 using marginal standardization adjusted for water insecurity, round-trip time to fetch water, and interactions between round-trip time to fetch water and water insecurity, and perceived SES, season, urbanicity, sex of household head, whether household had 5 L or more per person in drinking water stored, whether household used an improved water source, age, and age-squared. N = 4984 in 21 sites.
