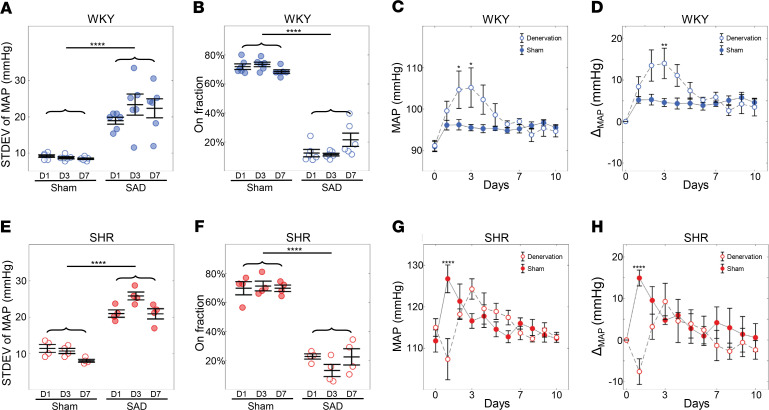
Figure 6. Increase in MAP in the WKY following SAD surgery.
MAP is reported as the average over the whole dark cycle at each day. MAP for day 0 is reported as the 5-day average of the MAP before SAD. The SAD was performed on day 1 and pressure data recording continued. The standard deviation of MAP was significantly higher in the SAD group compared with the sham group both in the WKY (A) and SHR (E). The on fraction in the SAD group is significantly lower compared with the sham group in both the WKY (B) and SHR (F). Combining these indicated the SAD procedure was successful. MAP measured in the WKY rats following sham (n = 6) and SAD (n = 6) surgeries. (C and D) MAP remains elevated in the SAD group compared with sham for the first 7 days following surgery with a peak average MAP of 105.2 mmHg for the SAD group at day 3 compared with 95.53 mmHg for the sham group. Panel D plots the change in MAP relative to the pressure at day 0. (G and H) MAP measured in SHR following sham (n = 4) and SAD (n = 4) surgeries. For the SHR, there was no increase in MAP in the denervation group compared with sham group. Panel H plots the change in MAP relative to the pressure at day 0. Data are shown as mean ± SEM with n = 6 for the WKY and n = 4 for the SHR. Statistical comparisons were made using 2-way ANOVA, Holm-Šídák multiple-comparisons test: *P < 0.05, **P < 0.01, ****P < 0.0001.

