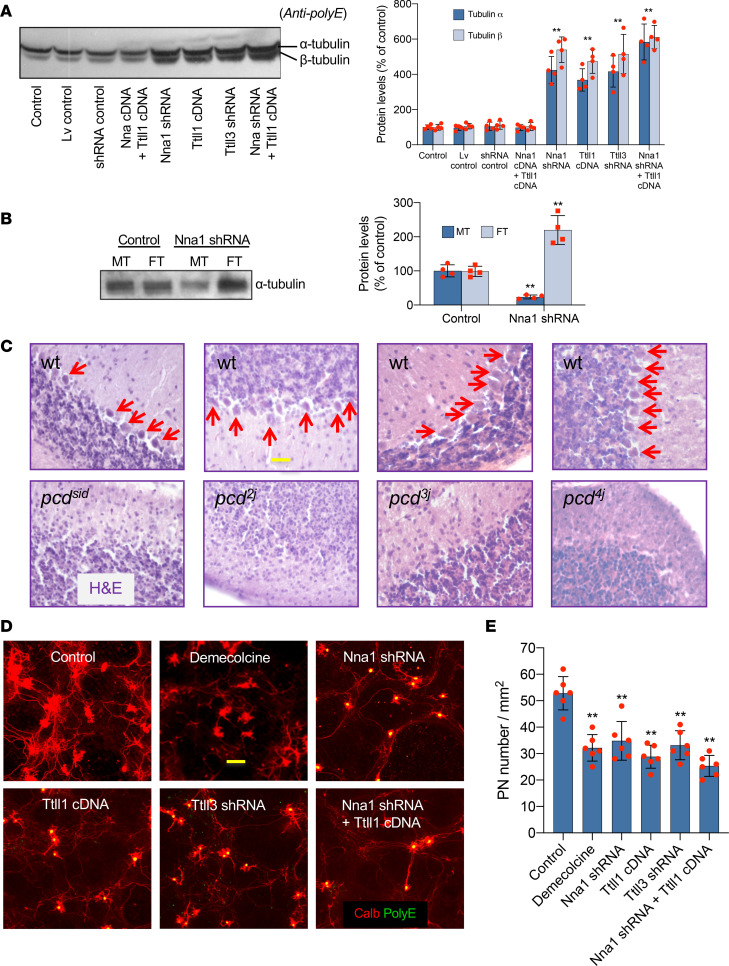
Figure 3. Tubulin hyperglutamylation and PN death.
(A) Glutamylated tubulins increased in PN cultures given Nna1 shRNA (decreased deglutamylase), Ttll1 cDNA (increased glutamylase), Ttll3 shRNA (decreased glycylase), or combined Nna1 shRNA plus Ttll1 cDNA. Dot pots with mean ± SD, n = 4–6; 2-tailed Student’s t test, compared with control, **P < 0.01. (B) Free dimeric tubulin proteins (FT) were accumulated, whereas microtubules (MT) were decreased in Nna1 shRNA PN cultures. Dot pots with mean ± SD, n = 4–6; 2-tailed Student’s t test, compared with control, **P < 0.01. (C) H&E cerebellar cortices show total loss of PNs (arrows) in various alleles of P40 pcd mutants. Scale bar: 30 μm. (D and E) Images and quantification show decreases in PN survival in WT cerebellar cell cultures given demecolcine (microtubule depolymerizer), Nna1 shRNA, Ttll1 cDNA, Ttll3 shRNA, or combined Nna1 shRNA plus Ttll1 cDNA showed Calb (red) PNs PolyE-stained (green) tubulin hyperglutamylation. Dot pots with mean ± SD, n = 6; 1-way ANOVA, experimental (Nna1 shDNA, Ttll1 cDNA, Ttll3 shRNA, and Nna1 shRNA plus Ttll1 cDNA) groups compared with control group, **P < 0.01; no statistical difference among experimental groups or among control, Lv control, shRNA control, and Nna1 cDNA plus Ttll1 cDNA groups. Scale bar: 50 μm. PN, Purkinje neuron; Nna1, neuronal nuclear protein induced by axotomy; Ttll1, tubulin tyrosine ligase–like 1.

