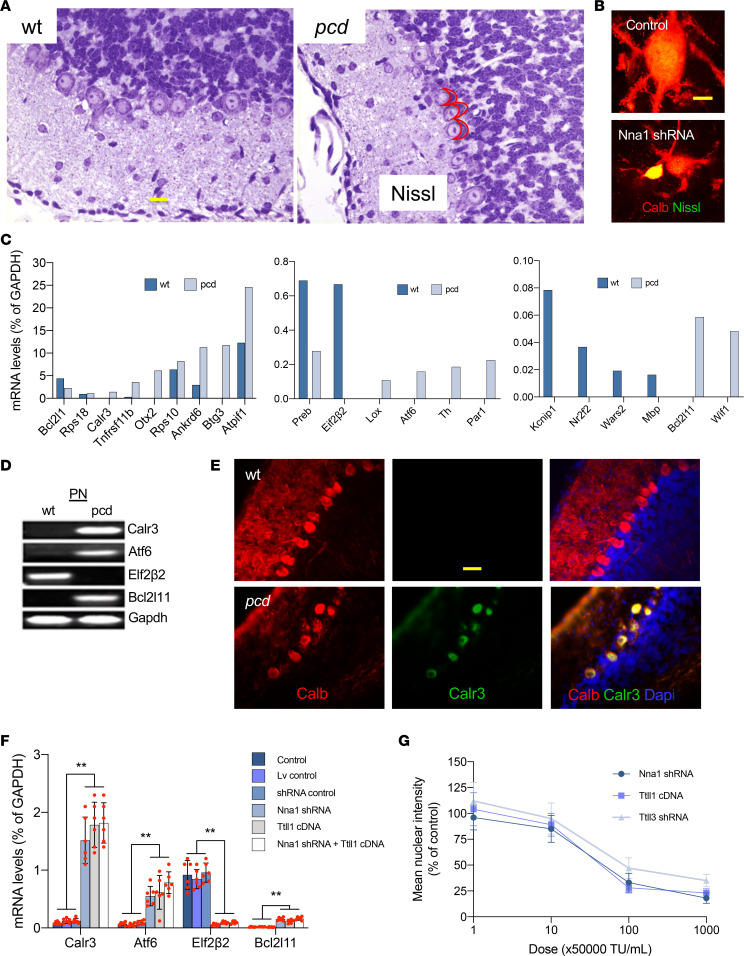
Figure 4. ER stress and protein synthesis inhibition.
(A) Images of Nissl-stained cerebellar cortices show cytoplasmic basal polyribosome mass (inside red meniscus in the right panel) in P15 pcd. Scale bar: 15 μm. (B) Nna1 shRNA induced abnormal polyribosomes (yellow), based on superimposed Nissl staining (green) and Calb (red) in cultured PNs. Scale bar: 15 μm. (C) Major changes of several mRNAs in P20 pcd PNs. (D) Increased ER stress markers (Calr3, Atf6, and Bcl2L11, an apoptotic initiator), and decreased protein synthesis initiator (Elf2β2) in P20 pcd PNs. (E) Cerebellar cortex images confirm the large increase of Calr3 (green) in P20 pcd PNs. Calb (red) PNs, DAPI (blue) cell nuclei. Scale bar: 15 μm. (F) Several markers show increased Calr3, Atf6, and Bcl2L11, plus decreased Elf2β2 in PN cultures given Nna1 shRNA (decreased deglutamylase), Ttll1 cDNA, or combined Nna1 shRNA plus Ttll1 cDNA (increased glutamylase). Dot pots with mean ± SD, n = 6; 1-way ANOVA, experimental (Nna1 shDNA, Ttll1 cDNA, and Nna1 shRNA plus Ttll1 cDNA) groups compared with control group, **P < 0.01; no statistical difference among experimental groups or among control, Lv control, and shRNA control groups. (G) Protein synthesis curves show concentration-dependent decreases in PN cultures given Nna1 shRNA, Ttll1 cDNA, or Ttll3 shRNA (decreased glycylase shown as percentage of controls). There were no significant differences among Nna1 shRNA, Ttll1 cDNA, and Ttll3 shRNA treatments. pcd, Purkinje cell degeneration; Nna1, neuronal nuclear protein induced by axotomy; PNs, Purkinje neurons; Calr3, calreticulin 3; Aft6, activating transcription factor 6; Bcl2L11, Elf2β2, eukaryotic initiator 2β2; B cell lymphoma 2–like protein 11; Ttll1, tubulin tyrosine ligase–like 1.

