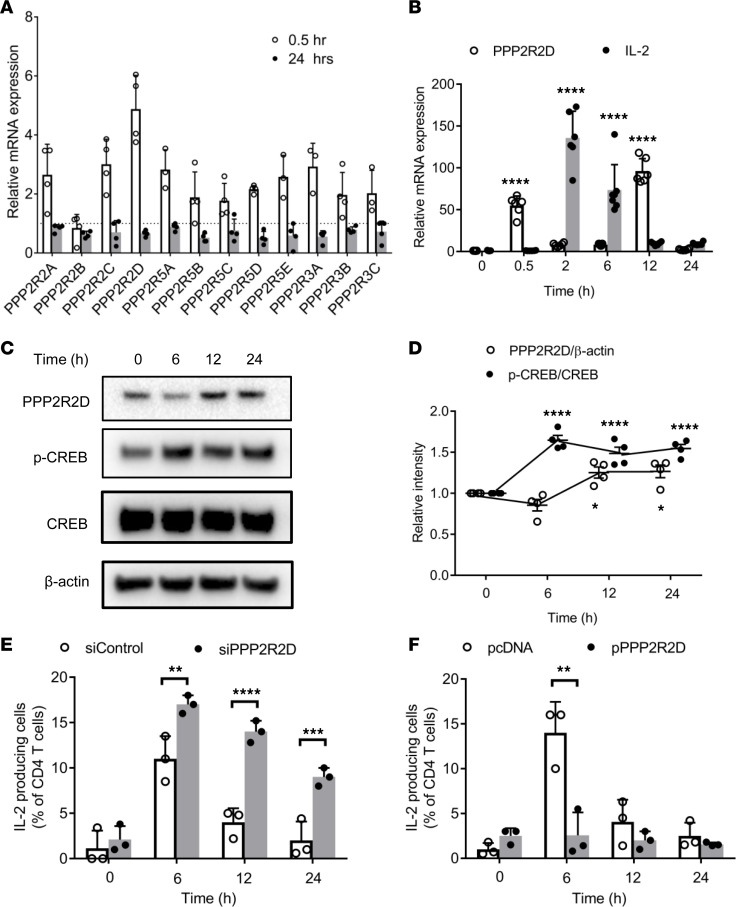
Figure 1. PPP2R2D expression increases and negatively regulates IL-2 production in human T cells following stimulation.
Human T cells derived from PBMCs of healthy subjects were stimulated with CD3 (OKT3) and CD28 antibodies. (A) The mRNA expression of the different regulatory subunits of PP2A in T cells at 0.5 and 24 hours after stimulation (n = 4). Dashed line represents the expression level of each subunit in T cells without stimulation. (B) The mRNA expression of PPP2R2D and IL-2 in T cells at 0, 0.5, 2, 6, 12, and 24 hours after stimulation (n = 6–7). All the expression levels were normalized to the samples without stimulation. (C) Western blot analysis of protein expression levels of PPP2R2D, p-CREB, CREB, and β-actin in T cells at 0, 6, 12, and 24 hours after stimulation. (D) Cumulative data (n = 4) for quantification of the levels of PPP2R2D and p-CREB in the blots shown in C. (E and F) Intracellular staining of IL-2 production in T cells at 0, 6, 12, and 24 hours after stimulation was analyzed by FACS. Cells were subjected to silencing of PPP2R2D (E) or to transfecting with PPP2R2D plasmid (F), and they were rested overnight before stimulation for indicated times. n = 3. (B and D) *P < 0.05, ****P < 0.001, when compared with corresponding 0 hour using 2-way ANOVA with Holm-Šidák multiple-comparisons test. (E and F) **P < 0.01, ***P < 0.001, ****P < 0.001 using multiple t test.

